OPEN-SOURCE SCRIPT
DCA Accumulator
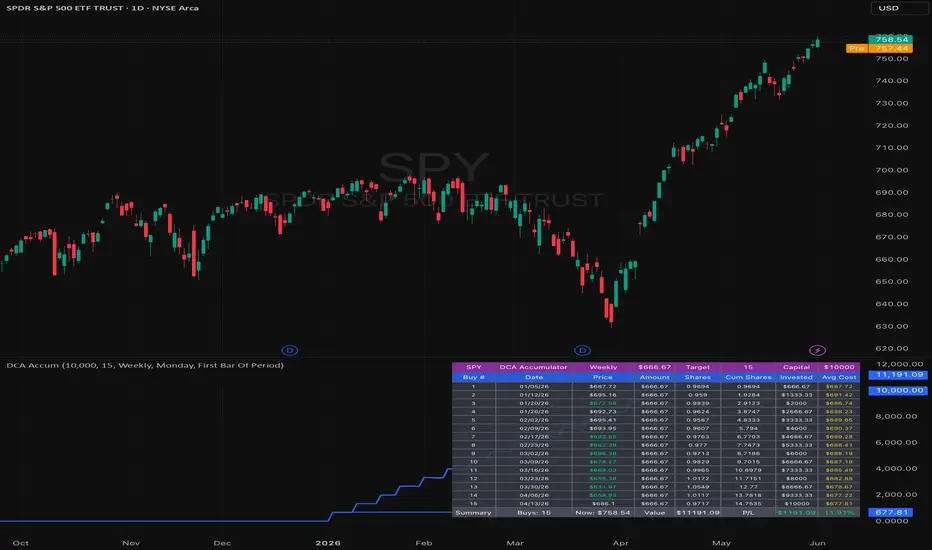
DCA Accumulator is a portfolio tracking indicator designed to help visualize a dollar-cost averaging plan on the currently selected chart symbol.
The script calculates scheduled purchases based on user-defined settings such as total capital, target number of buys, start date, buy frequency, and buy timing. The DCA amount is automatically calculated from the capital deployed divided by the target number of buys.
The indicator tracks:
* Number of completed buys
* Purchase date
* Purchase price
* Amount invested per buy
* Shares accumulated
* Total invested capital
* Average cost
* Current estimated position value
* Unrealized profit or loss
This tool is intended for planning, tracking, and educational analysis only. It does not generate buy or sell signals, does not predict future price movement, and does not guarantee any outcome. Values are based on chart data and the selected settings, so results may vary depending on symbol, timeframe, available history, and market conditions.
Past performance and historical chart behavior do not guarantee future results. This indicator should be used as one part of a broader research and risk management process, not as financial advice or a recommendation to buy, sell, or hold any asset.
The script calculates scheduled purchases based on user-defined settings such as total capital, target number of buys, start date, buy frequency, and buy timing. The DCA amount is automatically calculated from the capital deployed divided by the target number of buys.
The indicator tracks:
* Number of completed buys
* Purchase date
* Purchase price
* Amount invested per buy
* Shares accumulated
* Total invested capital
* Average cost
* Current estimated position value
* Unrealized profit or loss
This tool is intended for planning, tracking, and educational analysis only. It does not generate buy or sell signals, does not predict future price movement, and does not guarantee any outcome. Values are based on chart data and the selected settings, so results may vary depending on symbol, timeframe, available history, and market conditions.
Past performance and historical chart behavior do not guarantee future results. This indicator should be used as one part of a broader research and risk management process, not as financial advice or a recommendation to buy, sell, or hold any asset.
开源脚本
秉承TradingView的精神,该脚本的作者将其开源,以便交易者可以查看和验证其功能。向作者致敬!您可以免费使用该脚本,但请记住,重新发布代码须遵守我们的网站规则。

Independent market structure tools and educational chart analysis for learning and review only. Not financial advice.
免责声明
这些信息和出版物并非旨在提供,也不构成TradingView提供或认可的任何形式的财务、投资、交易或其他类型的建议或推荐。请阅读使用条款了解更多信息。
开源脚本
秉承TradingView的精神,该脚本的作者将其开源,以便交易者可以查看和验证其功能。向作者致敬!您可以免费使用该脚本,但请记住,重新发布代码须遵守我们的网站规则。
Independent market structure tools and educational chart analysis for learning and review only. Not financial advice.
免责声明
这些信息和出版物并非旨在提供,也不构成TradingView提供或认可的任何形式的财务、投资、交易或其他类型的建议或推荐。请阅读使用条款了解更多信息。