Volume Price Flow with HVN/LVN and Volume
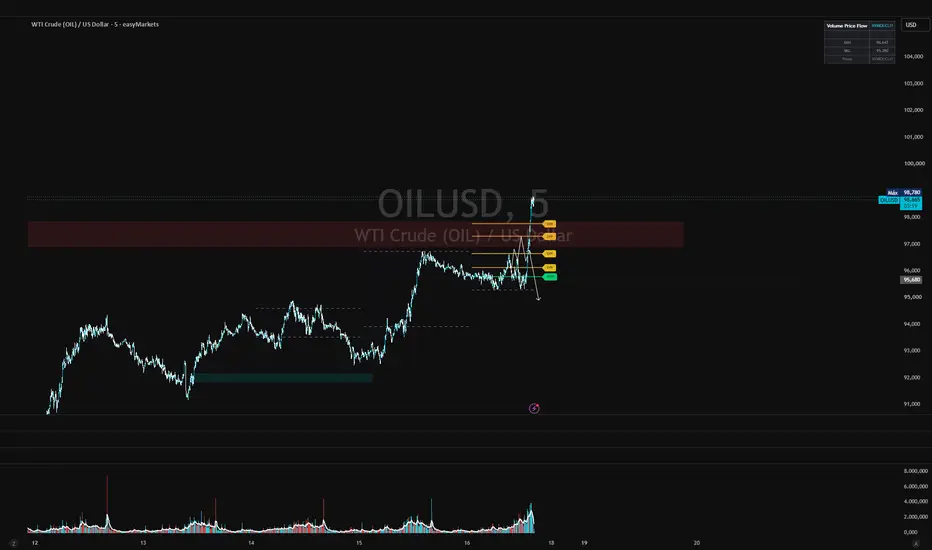
Volume Price Flow builds a volume profile for each daily session and marks on the chart where the market traded the most and the least. It works even for assets and brokers that do not report real volume.
The problem it solves
Many CFD and Forex assets, such as XAUUSD and indices, come with no volume or with unreliable tick volume, depending on the broker. Volume Price Flow detects the asset on the chart and retrieves volume data from a reference market with real volume. For example: gold → COMEX:GC1!, Bitcoin → Binance, Nasdaq → NAS100. If there is no volume at all, it uses the candle’s range (high − low) as an estimate.
What Appears on the Chart
Session Volume Histogram: separates buy volume from sell volume and highlights the Value Area. It comes with 1% opacity to avoid cluttering the chart.
POC (Point of Control): the price with the highest volume of the session, with the option to extend the line to the right.
VAH / VAL: the upper and lower limits of the Value Area (70% of volume, adjustable).
HVN (High Volume Nodes): volume peaks, price acceptance zones that typically act as support or resistance.
LVN (Low Volume Nodes): volume troughs, rejection zones through which the price tends to move quickly.
Panel: displays POC, VAH, VAL, and the symbol used as a volume proxy.
Main Settings
Number of sessions displayed and minimum number of bars per session.
Histogram resolution and, separately, the resolution used to detect HVN/LVN.
Node sensitivity: smoothing, peak/trough window, and minimum/maximum volume as a percentage of the highest level.
Colors, line style, transparency, and labels for HVN/LVN.
Automatic proxy or manual symbol.
This indicator is an original work. The Proxy Volume Engine, symbol mapping table, and delta intensity color logic were developed independently by the author and do not derive from any existing published script.
The problem it solves
Many CFD and Forex assets, such as XAUUSD and indices, come with no volume or with unreliable tick volume, depending on the broker. Volume Price Flow detects the asset on the chart and retrieves volume data from a reference market with real volume. For example: gold → COMEX:GC1!, Bitcoin → Binance, Nasdaq → NAS100. If there is no volume at all, it uses the candle’s range (high − low) as an estimate.
What Appears on the Chart
Session Volume Histogram: separates buy volume from sell volume and highlights the Value Area. It comes with 1% opacity to avoid cluttering the chart.
POC (Point of Control): the price with the highest volume of the session, with the option to extend the line to the right.
VAH / VAL: the upper and lower limits of the Value Area (70% of volume, adjustable).
HVN (High Volume Nodes): volume peaks, price acceptance zones that typically act as support or resistance.
LVN (Low Volume Nodes): volume troughs, rejection zones through which the price tends to move quickly.
Panel: displays POC, VAH, VAL, and the symbol used as a volume proxy.
Main Settings
Number of sessions displayed and minimum number of bars per session.
Histogram resolution and, separately, the resolution used to detect HVN/LVN.
Node sensitivity: smoothing, peak/trough window, and minimum/maximum volume as a percentage of the highest level.
Colors, line style, transparency, and labels for HVN/LVN.
Automatic proxy or manual symbol.
This indicator is an original work. The Proxy Volume Engine, symbol mapping table, and delta intensity color logic were developed independently by the author and do not derive from any existing published script.

免责声明
这些信息和出版物并非旨在提供,也不构成TradingView提供或认可的任何形式的财务、投资、交易或其他类型的建议或推荐。请阅读使用条款了解更多信息。
免责声明
这些信息和出版物并非旨在提供,也不构成TradingView提供或认可的任何形式的财务、投资、交易或其他类型的建议或推荐。请阅读使用条款了解更多信息。