OPEN-SOURCE SCRIPT
Hurst Cycles Multi-FLD TruSignal Strategies)
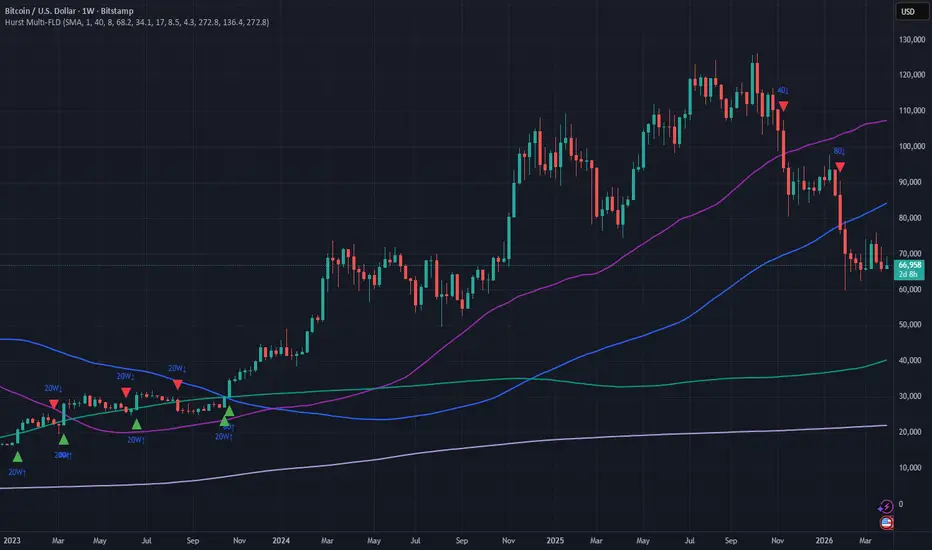
Hurst Cycles Trading Strategies: A Practical Guide
J.M. Hurst's cyclic analysisis one of the most respected methods for timing markets using cycles. It's based on the 10 Core Concepts multiple harmonically related cycles combine to drive price, forming recognizable shapes with synchronized troughs where possible.
The core trading tool is the Future Line of Demarcation (FLD) — a smoothed price line displaced forward by ~half the cycle wavelength. Price crossing an FLD reveals phase changes (trough or peak forming).
Here's how pros trade Hurst cycles effectively:
1. Core Signal: FLD Crossovers
Buy/Long: Price crosses above an FLD → potential cycle trough (bottom forming). Bullish for that cycle.
Sell/Short: Price crosses below an FLD → potential cycle peak (top forming). Bearish for that cycle.
Signal Type Condition Interpretation Typical Action Bullish Trough Close > FLD Cycle turning up Enter long, add on confluence Bearish Peak Close < FLD Cycle turning down Enter short or exit long No Cross Price "bounces" off FLD Support/resistance Watch for breakout
2. Confluence is Essential (Highest Probability Trades)
Single-cycle signals can whipsaw. Pros wait for alignment across multiple cycles
Strong Buy: Price crosses above 2–3 FLDs simultaneously (e.g., 20-day + 40-day + 80-day).
Strong Sell: Crosses below multiple FLDs.Use longer cycles (80-day/40-day) for trend direction, shorter (20-day/10-day/5-day) for precise entry timing.
Example: In an uptrend (price above longer FLDs), only take bullish crosses from shorter cycles.
3. Use Synchronized Trough Projections for Timing (Concept #7)
Anchor to a recent common trough (strong low with clustered bullish crosses).
Project future trough dates using nominal wavelengths (or your custom-tuned ones).
Strategy:
Anticipate bounces near projected trough lines (especially clusters).
Enter longs just before/after a projected trough if FLD crosses confirm upward.
Peaks ~half-wavelength later are potential exits or shorts.
Pro tip: Cycles vary slightly (Concept #6) — tune wavelengths to recent measured lows-to-lows for better fit.
4. Trend & Skew Awareness (Concepts #8–10)
Underlying Trend: Longer cycles dominate. If price is above 80-day FLD, favor longs (stretched upward moves).
Skew: Moves aren't symmetric — up legs can be long/slow, down legs sharp (or vice versa).
Valid Trend Lines (VTL): Connect troughs/peaks — breaks confirm trend changes (advanced, not in basic indicator).
Time translation: Actual turns may shift slightly from projections — use candle confirmation.
5. Practical Strategies
Strategy Name Description Best Markets/Timeframes Risk Management Confluence Swing Wait for 2+ FLD upward crosses near projected trough cluster.Stocks/Indices (daily) Stop below recent trough; target next projected peakTrend Filter Only trade in direction of longer cycles (e.g., long if above 80-day FLD).All (daily/weekly) Trail stops using shorter FLDs Projection Fade Short near projected peak clusters in downtrends; long near troughs in uptrends.Crypto/Futures (daily/4H)Small position until FLD confirmMulti-Cycle Pyramid. Add to winners on successive shorter-cycle bullish crosses.Trending markets Scale out at projected peaks
J.M. Hurst's cyclic analysisis one of the most respected methods for timing markets using cycles. It's based on the 10 Core Concepts multiple harmonically related cycles combine to drive price, forming recognizable shapes with synchronized troughs where possible.
The core trading tool is the Future Line of Demarcation (FLD) — a smoothed price line displaced forward by ~half the cycle wavelength. Price crossing an FLD reveals phase changes (trough or peak forming).
Here's how pros trade Hurst cycles effectively:
1. Core Signal: FLD Crossovers
Buy/Long: Price crosses above an FLD → potential cycle trough (bottom forming). Bullish for that cycle.
Sell/Short: Price crosses below an FLD → potential cycle peak (top forming). Bearish for that cycle.
Signal Type Condition Interpretation Typical Action Bullish Trough Close > FLD Cycle turning up Enter long, add on confluence Bearish Peak Close < FLD Cycle turning down Enter short or exit long No Cross Price "bounces" off FLD Support/resistance Watch for breakout
2. Confluence is Essential (Highest Probability Trades)
Single-cycle signals can whipsaw. Pros wait for alignment across multiple cycles
Strong Buy: Price crosses above 2–3 FLDs simultaneously (e.g., 20-day + 40-day + 80-day).
Strong Sell: Crosses below multiple FLDs.Use longer cycles (80-day/40-day) for trend direction, shorter (20-day/10-day/5-day) for precise entry timing.
Example: In an uptrend (price above longer FLDs), only take bullish crosses from shorter cycles.
3. Use Synchronized Trough Projections for Timing (Concept #7)
Anchor to a recent common trough (strong low with clustered bullish crosses).
Project future trough dates using nominal wavelengths (or your custom-tuned ones).
Strategy:
Anticipate bounces near projected trough lines (especially clusters).
Enter longs just before/after a projected trough if FLD crosses confirm upward.
Peaks ~half-wavelength later are potential exits or shorts.
Pro tip: Cycles vary slightly (Concept #6) — tune wavelengths to recent measured lows-to-lows for better fit.
4. Trend & Skew Awareness (Concepts #8–10)
Underlying Trend: Longer cycles dominate. If price is above 80-day FLD, favor longs (stretched upward moves).
Skew: Moves aren't symmetric — up legs can be long/slow, down legs sharp (or vice versa).
Valid Trend Lines (VTL): Connect troughs/peaks — breaks confirm trend changes (advanced, not in basic indicator).
Time translation: Actual turns may shift slightly from projections — use candle confirmation.
5. Practical Strategies
Strategy Name Description Best Markets/Timeframes Risk Management Confluence Swing Wait for 2+ FLD upward crosses near projected trough cluster.Stocks/Indices (daily) Stop below recent trough; target next projected peakTrend Filter Only trade in direction of longer cycles (e.g., long if above 80-day FLD).All (daily/weekly) Trail stops using shorter FLDs Projection Fade Short near projected peak clusters in downtrends; long near troughs in uptrends.Crypto/Futures (daily/4H)Small position until FLD confirmMulti-Cycle Pyramid. Add to winners on successive shorter-cycle bullish crosses.Trending markets Scale out at projected peaks
开源脚本
秉承TradingView的精神,该脚本的作者将其开源,以便交易者可以查看和验证其功能。向作者致敬!您可以免费使用该脚本,但请记住,重新发布代码须遵守我们的网站规则。

免责声明
这些信息和出版物并非旨在提供,也不构成TradingView提供或认可的任何形式的财务、投资、交易或其他类型的建议或推荐。请阅读使用条款了解更多信息。
开源脚本
秉承TradingView的精神,该脚本的作者将其开源,以便交易者可以查看和验证其功能。向作者致敬!您可以免费使用该脚本,但请记住,重新发布代码须遵守我们的网站规则。
免责声明
这些信息和出版物并非旨在提供,也不构成TradingView提供或认可的任何形式的财务、投资、交易或其他类型的建议或推荐。请阅读使用条款了解更多信息。