OPEN-SOURCE SCRIPT
High Volume Rejection Zones [BOSWaves]
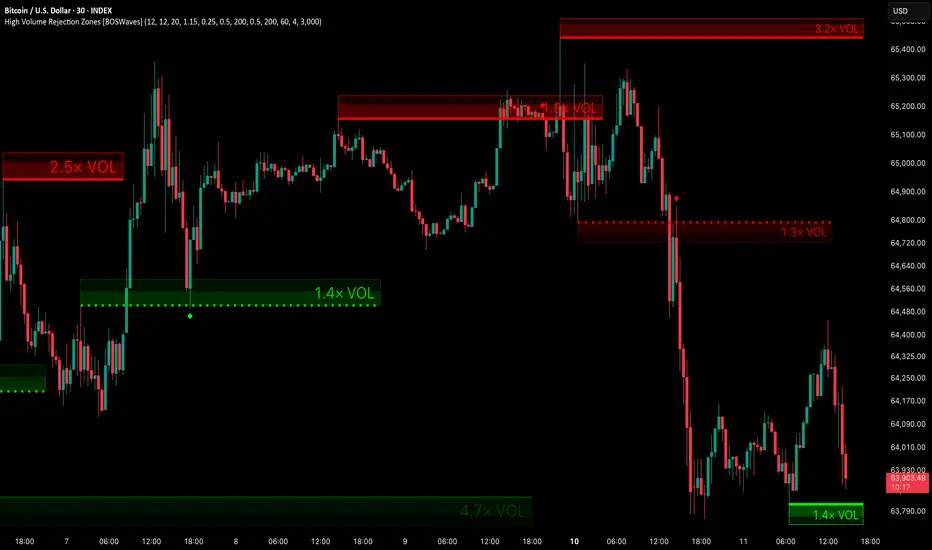
High Volume Rejection Zones [BOSWaves] - Volume-Validated Swing Rejection Detection with Quality-Scored Dual-Layer Zones and Flip Tracking
Overview
High Volume Rejection Zones [BOSWaves] is a swing-anchored supply and demand zone system that identifies price levels where confirmed pivot highs and lows were accompanied by meaningful rejection wick structure and above-average volume participation, where zone depth, inner core sizing, and visual intensity are driven by a composite rejection quality score derived from wick magnitude, close distance from the extreme, and relative volume strength rather than arbitrary fixed zone dimensions.

Instead of marking every swing pivot regardless of the conviction behind it, each zone requires three simultaneous conditions to be satisfied: the pivot candle's volume must exceed its rolling average by the configured multiple, the rejection wick must represent a minimum fraction of the candle's total range, and the close must have moved sufficiently far from the extreme, confirming that price was decisively pushed away from the level rather than drifting. Only when all three conditions are met does a zone form, ensuring every level on the chart has measurable evidence of genuine rejection activity behind it.
This creates a zone framework that goes beyond simple level marking into active lifecycle management. Each zone tracks whether price retests and holds the level, displaying a hold signal when the interaction confirms structural defense, then converts visually when price breaks through the zone, flipping from resistance to potential support or from support to potential resistance and monitoring for a subsequent flip retest where the former opposing level is tested from the new side. Zones fade progressively with age using a cubic opacity curve, expired zones dissolve automatically, and a configurable historical limit manages the total object count across the chart history.
Price is therefore evaluated not just against levels that meet structural swing criteria but against levels with quantified rejection evidence, active hold and flip tracking, and aging-aware visual treatment that communicates zone relevance at a glance.
Conceptual Framework
High Volume Rejection Zones is founded on the principle that meaningful supply and demand zones require simultaneous evidence across three independent dimensions: the price was structurally significant enough to form a confirmed swing, the rejection from that level was decisive enough to produce a meaningful wick, and volume participation was sufficient to indicate that the rejection was driven by genuine market activity rather than low-liquidity price movement.
Traditional pivot-based zone tools mark levels from confirmed swings without filtering for the quality of the rejection at those pivots, producing charts populated with zones where price barely paused rather than zones where price was actively defended by participating volume. This framework requires all three rejection dimensions to exceed their configured thresholds simultaneously before a zone is committed, concentrating the chart on the subset of swing pivots with the strongest combined evidence of institutional rejection activity.
Three core principles guide the design:
This shifts supply and demand zone analysis from pivot-counting into evidence-weighted rejection identification where every visible zone carries quantified conviction credentials and active interaction tracking.
Theoretical Foundation
The indicator combines confirmed pivot detection with simultaneous three-condition rejection filtering, a composite quality score derived from normalized wick, close, and volume components, dual-layer zone construction with quality-proportional inner core sizing, cubic fade curve aging, hold retest detection, break detection with visual flip conversion, and flip retest detection with independent completion tracking per zone.
Pivot confirmation uses a symmetric left-right bar requirement to identify structurally validated swing highs and lows. The rejection quality score weights the wick component at forty percent, the close distance component at thirty-five percent, and the relative volume component at twenty-five percent, each normalized to a zero-to-one scale against their respective reference values. The coreDepth variable maps this composite score to an inner zone boundary that ranges from twenty-two percent to seventy percent of the total zone height, producing inner zones that are small for borderline rejections and deep for high-conviction rejections. The cubic fade curve applies a non-linear aging effect that preserves zone visibility through most of the maximum age before accelerating the fade near expiry.
Four internal systems operate in tandem:
This design ensures every zone carries its own rejection quality credentials, tracks its own lifecycle state, and communicates both structural relevance and interaction history through its visual properties at all times.
How It Works
High Volume Rejection Zones evaluates price through a sequence of pivot-aware and evidence-validated processes:
Together, these elements form a continuously updating rejection zone system where every visible level has passed a multi-condition evidence filter, carries a quality-proportional visual footprint, and reflects its current lifecycle state through color, opacity, border style, and signal markers.
Interpretation
High Volume Rejection Zones should be interpreted as an evidence-filtered structural level system with active lifecycle state communication:
Zone opacity, inner core depth, RVOL label, and lifecycle state collectively communicate more about each level's structural relevance than zone location alone.
Signal Logic & Visual Cues
High Volume Rejection Zones generates four distinct signal types across two lifecycle phases:
Each zone generates at most one hold signal and one flip signal across its full lifecycle, preventing repeated signals on the same level and focusing attention on the first confirming interaction of each type.
Alert generation covers bullish and bearish zone formation, bullish and bearish hold events, and bullish and bearish flip confirmations for comprehensive systematic monitoring.
Strategy Integration
High Volume Rejection Zones fits within volume-validated structural level and supply and demand zone-based trading approaches:
Technical Implementation Details
Optimal Application Parameters
Timeframe Guidance:
Suggested Baseline Configuration:
These suggested parameters should be used as a baseline; their effectiveness depends on the instrument's swing frequency, volume behavior, and preferred zone density, so fine-tuning is expected for optimal performance.
Parameter Calibration Notes
Use the following adjustments to refine behavior without altering the core logic:
Adjustments should be incremental and evaluated across multiple session types rather than isolated market conditions.
Performance Characteristics
High Effectiveness:
Reduced Effectiveness:
Integration Guidelines
Disclaimer
High Volume Rejection Zones [BOSWaves] is a professional-grade volume-validated supply and demand zone detection and lifecycle tracking tool. It uses multi-condition rejection filtering with quality-scored zone construction but does not predict future price movements. Results depend on market conditions, instrument volume characteristics, parameter selection, and disciplined execution. BOSWaves recommends deploying this indicator within a broader analytical framework that incorporates momentum context, trend structure, and comprehensive risk management.
Overview
High Volume Rejection Zones [BOSWaves] is a swing-anchored supply and demand zone system that identifies price levels where confirmed pivot highs and lows were accompanied by meaningful rejection wick structure and above-average volume participation, where zone depth, inner core sizing, and visual intensity are driven by a composite rejection quality score derived from wick magnitude, close distance from the extreme, and relative volume strength rather than arbitrary fixed zone dimensions.
Instead of marking every swing pivot regardless of the conviction behind it, each zone requires three simultaneous conditions to be satisfied: the pivot candle's volume must exceed its rolling average by the configured multiple, the rejection wick must represent a minimum fraction of the candle's total range, and the close must have moved sufficiently far from the extreme, confirming that price was decisively pushed away from the level rather than drifting. Only when all three conditions are met does a zone form, ensuring every level on the chart has measurable evidence of genuine rejection activity behind it.
This creates a zone framework that goes beyond simple level marking into active lifecycle management. Each zone tracks whether price retests and holds the level, displaying a hold signal when the interaction confirms structural defense, then converts visually when price breaks through the zone, flipping from resistance to potential support or from support to potential resistance and monitoring for a subsequent flip retest where the former opposing level is tested from the new side. Zones fade progressively with age using a cubic opacity curve, expired zones dissolve automatically, and a configurable historical limit manages the total object count across the chart history.
Price is therefore evaluated not just against levels that meet structural swing criteria but against levels with quantified rejection evidence, active hold and flip tracking, and aging-aware visual treatment that communicates zone relevance at a glance.
Conceptual Framework
High Volume Rejection Zones is founded on the principle that meaningful supply and demand zones require simultaneous evidence across three independent dimensions: the price was structurally significant enough to form a confirmed swing, the rejection from that level was decisive enough to produce a meaningful wick, and volume participation was sufficient to indicate that the rejection was driven by genuine market activity rather than low-liquidity price movement.
Traditional pivot-based zone tools mark levels from confirmed swings without filtering for the quality of the rejection at those pivots, producing charts populated with zones where price barely paused rather than zones where price was actively defended by participating volume. This framework requires all three rejection dimensions to exceed their configured thresholds simultaneously before a zone is committed, concentrating the chart on the subset of swing pivots with the strongest combined evidence of institutional rejection activity.
Three core principles guide the design:
[]Zone formation should require concurrent validation across wick structure, close positioning, and volume significance, ensuring each zone reflects a genuine multi-dimensional rejection event rather than a mechanical pivot detection.
[]Zone depth should scale with rejection quality, with the inner core zone growing proportionally as wick conviction, close distance, and volume strength increase, providing a visual quality gradient across zones of varying rejection evidence.- Zones should track their own lifecycle through hold detection, break identification, flip conversion, and age-based fading, communicating structural relevance dynamically rather than remaining static rectangles regardless of subsequent price interaction.
This shifts supply and demand zone analysis from pivot-counting into evidence-weighted rejection identification where every visible zone carries quantified conviction credentials and active interaction tracking.
Theoretical Foundation
The indicator combines confirmed pivot detection with simultaneous three-condition rejection filtering, a composite quality score derived from normalized wick, close, and volume components, dual-layer zone construction with quality-proportional inner core sizing, cubic fade curve aging, hold retest detection, break detection with visual flip conversion, and flip retest detection with independent completion tracking per zone.
Pivot confirmation uses a symmetric left-right bar requirement to identify structurally validated swing highs and lows. The rejection quality score weights the wick component at forty percent, the close distance component at thirty-five percent, and the relative volume component at twenty-five percent, each normalized to a zero-to-one scale against their respective reference values. The coreDepth variable maps this composite score to an inner zone boundary that ranges from twenty-two percent to seventy percent of the total zone height, producing inner zones that are small for borderline rejections and deep for high-conviction rejections. The cubic fade curve applies a non-linear aging effect that preserves zone visibility through most of the maximum age before accelerating the fade near expiry.
Four internal systems operate in tandem:
[]Rejection Validation Engine: Tests each confirmed pivot against the relative volume threshold, minimum wick ratio, and minimum close distance simultaneously, qualifying only pivots where all three conditions are met and calculating the composite rejection quality score from the normalized component values.
[]Zone Construction System: Creates dual-layer outer and inner zone boxes with ATR-scaled height and quality-proportional inner boundary positioning, adds a precise pivot price level line, and displays the relative volume multiple as a label when the show volume setting is enabled.
[]Hold and Break Tracking System: On each bar after zone creation, tests for hold retests where price touches the zone without closing through it and generates hold signals. Tests for full breaks where price closes beyond the outer zone boundary, converts zone coloring and border style to the opposing direction, and begins monitoring for flip retests.
[]Aging and Lifecycle Management System: Applies a cubic opacity fade curve based on zone age relative to the configured maximum, dissolves expired zones with a near-transparent final state before removing them, and enforces the historical zone count limit by removing oldest objects first.
This design ensures every zone carries its own rejection quality credentials, tracks its own lifecycle state, and communicates both structural relevance and interaction history through its visual properties at all times.
How It Works
High Volume Rejection Zones evaluates price through a sequence of pivot-aware and evidence-validated processes:
[]Pivot Detection: Swing highs and lows are confirmed when the configured number of bars to the left and right validate the structural significance of the pivot, providing the structural anchor for rejection testing.
[]Wick Ratio Measurement: The upper wick of a pivot high is measured as a fraction of the full candle range. The lower wick of a pivot low is measured similarly. Values below the configured minimum exclude the pivot from zone formation.
[]Close Distance Measurement: The distance between the pivot extreme and the close is expressed as a fraction of the candle range, measuring how decisively price moved away from the extreme before the bar closed. Values below the minimum threshold exclude the pivot.
[]Relative Volume Test: The pivot candle's volume is divided by its rolling SMA baseline. Values below the configured multiple exclude the pivot, ensuring only bars with meaningful participation qualify.
[]Rejection Quality Scoring: For qualifying pivots, each of the three components is normalized to a zero-to-one scale against its reference value and combined with the configured weightings to produce a composite rejection quality score.
[]Zone Depth Calculation: The composite quality score maps linearly to a core depth fraction that determines how far the inner zone boundary sits within the total ATR-scaled zone height, producing quality-proportional inner zones.
[]Dual-Layer Zone Creation: An outer zone box spans the full ATR height with a transparent fill. An inner zone box spans the quality-proportional depth with a denser fill. A level line marks the precise pivot price. A relative volume label displays the RVOL multiple when enabled.
[]Hold Retest Detection: After zone creation, each bar tests whether price touched the zone without closing through it in the opposing direction. A qualifying touch generates a hold signal diamond marker and brightens the zone border.
[]Break Detection and Flip Conversion: When price closes beyond the outer zone boundary in the opposing direction, the zone converts visually to the opposing direction color with dotted borders, indicating the former resistance or support level has been broken and may now function as the opposing structural reference.
[]Flip Retest Detection: After a zone break, each subsequent bar tests whether price retouched the outer boundary from the new side and closed beyond it, generating a flip signal diamond marker and brightening the converted zone's border.
[]Age-Based Fading: On each bar, the zone age is calculated and a cubic fade curve maps the age fraction to increasing transparency values applied to all zone visual properties, causing zones to gradually dissolve toward invisibility as they approach the maximum age.
[]Expiry and Cleanup: Zones reaching maximum age are set to near-transparent final state and all references are cleared. The historical object arrays are trimmed when the maximum zone count is exceeded by removing the oldest entries.
Together, these elements form a continuously updating rejection zone system where every visible level has passed a multi-condition evidence filter, carries a quality-proportional visual footprint, and reflects its current lifecycle state through color, opacity, border style, and signal markers.
Interpretation
High Volume Rejection Zones should be interpreted as an evidence-filtered structural level system with active lifecycle state communication:
[]Bearish Rejection Zone (Red): Formed at a confirmed pivot high where volume, wick, and close distance thresholds were all satisfied simultaneously, identifying a price level where selling pressure was both structurally significant and volume-backed.
[]Bullish Rejection Zone (Green): Formed at a confirmed pivot low where the equivalent buying pressure thresholds were satisfied, identifying a level where buying activity was structurally significant and volume-backed.
[]Outer Zone: The full ATR-scaled zone box with the lighter fill represents the complete rejection range anchored to the pivot extreme, serving as the primary zone boundary and the reference for break detection.
[]Inner Core Zone: The denser inner fill occupying a quality-proportional fraction of the outer zone height represents the highest-confidence portion of the rejection zone where price and volume evidence was strongest. Larger inner cores indicate higher composite rejection quality.
[]Level Line: The solid line at the precise pivot price provides a pin-point structural reference at the exact level where the rejection candle's extreme registered.
[]Relative Volume Label: The RVOL multiple displayed on each zone quantifies how significantly above average the pivot candle's volume was, providing an immediate conviction reading for each zone.
[]Zone Fading: Progressively increasing transparency as zones age reflects diminishing structural relevance over time. Fresh zones are fully opaque and most relevant; older zones are more transparent and carry reduced structural weight.
[]Flipped Zone (Converted Color): When price closes through a zone's outer boundary, the zone converts to the opposing direction's color with dotted borders, indicating the former support or resistance may now function in the opposite structural role.
[]◆ Hold Signal: Diamond marker appearing when price retests an active unbroken zone and closes without penetrating through it, confirming that the rejection level is actively defending its structural role.
[]◆ Flip Signal: Diamond marker appearing when price retests a previously broken and converted zone from the new side, confirming that the former opposing level has been accepted in its new structural role.
Zone opacity, inner core depth, RVOL label, and lifecycle state collectively communicate more about each level's structural relevance than zone location alone.
Signal Logic & Visual Cues
High Volume Rejection Zones generates four distinct signal types across two lifecycle phases:
[]Bullish Hold Signal (◆): Generated when price touches a bullish rejection zone from above and closes back above the pivot price level without closing through the outer zone bottom, confirming structural defense of the demand level.
[]Bearish Hold Signal (◆): Generated when price touches a bearish rejection zone from below and closes back below the pivot price level without closing through the outer zone top, confirming structural defense of the supply level.
[]Bullish Flip Signal (◆): Generated when price retests the top boundary of a previously broken bearish zone from above and closes above it, confirming that former resistance has been accepted as support.
[]Bearish Flip Signal (◆): Generated when price retests the bottom boundary of a previously broken bullish zone from below and closes below it, confirming that former support has been accepted as resistance.
Each zone generates at most one hold signal and one flip signal across its full lifecycle, preventing repeated signals on the same level and focusing attention on the first confirming interaction of each type.
Alert generation covers bullish and bearish zone formation, bullish and bearish hold events, and bullish and bearish flip confirmations for comprehensive systematic monitoring.
Strategy Integration
High Volume Rejection Zones fits within volume-validated structural level and supply and demand zone-based trading approaches:
[]RVOL-Weighted Zone Prioritization: Favor zones displaying higher relative volume multiples in the label over borderline-qualifying zones, as greater volume participation at the rejection provides stronger evidence of institutional activity at that level.
[]Inner Core Precision Entries: Use the inner core zone as a precision entry reference rather than the full outer boundary, placing entries where the quality-weighted evidence was most concentrated rather than at the outer ATR extent of the zone.
[]Hold Signal Confirmation Entries: Use hold signals as lower-risk re-entry or initial entry triggers within established trends, treating a confirmed zone defense as evidence that the structural level remains operationally relevant rather than merely marked.
[]Flip Zone Framework: Monitor converted zones as potential support-to-resistance and resistance-to-support levels, using flip signals as confirmation that the role conversion has been accepted by subsequent price action before committing to the new directional interpretation.
[]Zone Age and Opacity Context: Weight fresher, more opaque zones more heavily than faded older zones in trade planning, as recent rejections formed under current market conditions carry more relevance than historical rejections formed in different volatility or volume regimes.
[]Multi-Timeframe Zone Hierarchy: Apply higher-timeframe rejection zones as primary directional structural context, using lower-timeframe zone interactions for entry timing precision within the structural bias established by the higher-timeframe level.
Technical Implementation Details
[]Pivot Detection: Symmetric left-right bar confirmation for swing highs and lows with configurable lookback
[]Rejection Filter: Simultaneous three-condition testing across relative volume, wick ratio, and close distance thresholds
[]Quality Score: Weighted composite from normalized wick, close, and RVOL components mapping to inner core depth fraction
[]Zone Construction: Dual-layer outer and inner ATR-scaled boxes with quality-proportional inner boundary and pivot price level line
[]Lifecycle System: Hold detection, break identification with flip conversion, flip retest detection with per-zone completion flags
[]Aging System: Cubic fade curve applied to all visual properties with automatic expiry and object cleanup
[]Historical Management: Array-based object tracking with configurable maximum count enforced by oldest-first removal
[]Performance Profile: Optimized with calc_bars_count and max_bars_back configuration for deep historical pivot detection across extended chart histories
Optimal Application Parameters
Timeframe Guidance:
[]1 - 5 min: Intraday rejection zone mapping for scalping with shorter pivot lookback and tighter volume threshold for responsive zone formation on fast intraday swings
[]15 - 60 min: Session-level supply and demand identification with balanced pivot lookback and moderate rejection thresholds for meaningful zone density across typical session structures
[]4H - Daily: Swing-level institutional rejection mapping with longer pivot lookback and higher volume thresholds reflecting the larger participation events that define significant higher-timeframe levels
Suggested Baseline Configuration:
[]Pivot Lookback Left: 12
[]Pivot Lookback Right: 12
[]Volume Average Length: 20
[]Minimum Relative Volume: 1.15
[]Minimum Rejection Wick: 0.25
[]Minimum Close Rejection: 0.50
[]ATR Length: 200
[]Zone ATR Width: 0.30
[]Maximum Zone Age: 200
[]Historical Zones: 60
[]Show Relative Volume: Enabled- Retest Signals: Enabled
These suggested parameters should be used as a baseline; their effectiveness depends on the instrument's swing frequency, volume behavior, and preferred zone density, so fine-tuning is expected for optimal performance.
Parameter Calibration Notes
Use the following adjustments to refine behavior without altering the core logic:
[]Too many zones forming: Increase Minimum Relative Volume to demand stronger volume participation, increase Minimum Rejection Wick to require more decisive wick structure, or increase both Pivot Lookback values to demand more structurally significant swings.
[]Zones not forming frequently enough: Decrease Minimum Relative Volume toward 1.0 for more inclusive volume qualification, or decrease Pivot Lookback values toward 5 for faster swing confirmation on shorter structural moves.
[]Zone height too large or small: Adjust Zone ATR Width to scale the vertical zone extent relative to the instrument's typical volatility, calibrating zone depth to realistic price interaction ranges at the target timeframe.
[]Inner cores consistently too small: The inner core scales with rejection quality. Consistently small cores indicate borderline-qualifying rejections. This is expected behavior and reflects the lower composite evidence at those levels rather than a parameter issue.
[]Zones fading too quickly or slowly: Adjust Maximum Zone Age to control how many bars zones remain visible before expiring. Shorter ages produce a chart showing only recent levels; longer ages retain historical structural references for extended analysis.
[]Too many historical zones cluttering the chart: Reduce Historical Zones to limit the total object count, focusing the chart on the most recent qualifying levels within the retained history.- Volume baseline distorted by outlier sessions: Increase Volume Average Length to smooth the SMA baseline across more history, reducing the influence of individual extreme volume sessions on the relative volume threshold calculation.
Adjustments should be incremental and evaluated across multiple session types rather than isolated market conditions.
Performance Characteristics
High Effectiveness:
[]Trending markets where swing pivots form at structurally significant levels and are accompanied by volume-backed rejection that creates reliable supply and demand references for subsequent pullback interactions
[]Liquid instruments with consistent volume participation where the SMA baseline accurately classifies above-average bars and relative volume readings reliably indicate genuine institutional activity at pivot levels
[]Supply and demand zone trading approaches where the multi-condition rejection filter concentrates attention on the highest-conviction structural levels rather than marking every mechanical pivot
[]Flip zone strategies where broken levels converting to opposing structural roles provide high-probability setups as price returns to test the former level from the new side
Reduced Effectiveness:
[]Choppy, low-volume markets where pivot formation is frequent but volume at each swing is consistently below average, causing the RVOL filter to suppress most zone formation and leave the chart sparse
[]Instruments with inconsistent volume distribution where the SMA baseline is distorted by session type variation, producing unreliable relative volume classifications across different trading periods
[]Very fast-moving markets where swing confirmation requires sufficient right-side bars that pivots are confirmed significantly after the actual structural event, reducing the timeliness of zone placement
[]Markets with extremely small bar ranges where wick ratios become unreliable as noise rather than genuine rejection structure, causing the wick filter to produce inconsistent zone qualification
[]Consolidation environments where price oscillates near prior rejection zones without clear directional follow-through, generating frequent hold signals without the subsequent trending behavior that validates the zone's structural significance
Integration Guidelines
[]Confluence: Combine with BOSWaves momentum tools, market structure indicators, or volume profile analysis to validate rejection zone interactions with broader analytical context before committing to structural level-based trades
[]RVOL Hierarchy: Build a priority hierarchy among active zones based on RVOL multiples. Zones with the highest relative volume readings represent the most convincing institutional rejection events and should be treated as primary structural references over borderline-qualifying zones.
[]Hold Signal Discipline: Treat hold signals as structural confirmation rather than automatic entries. A hold signal confirms the level defended but not the direction or magnitude of the subsequent move. Combine with trend alignment and momentum context before acting.
[]Flip Zone Patience: Allow converted zones to develop their flip retest naturally rather than anticipating the interaction. The flip signal requires price to retest the converted boundary and close through it from the new side, confirming role acceptance rather than mere proximity.
[]Age Awareness: Monitor zone opacity as a relevance indicator. Fully opaque fresh zones reflect current market conditions while heavily faded older zones may have formed under different volatility and volume regimes that are no longer representative of current structure.
Disclaimer
High Volume Rejection Zones [BOSWaves] is a professional-grade volume-validated supply and demand zone detection and lifecycle tracking tool. It uses multi-condition rejection filtering with quality-scored zone construction but does not predict future price movements. Results depend on market conditions, instrument volume characteristics, parameter selection, and disciplined execution. BOSWaves recommends deploying this indicator within a broader analytical framework that incorporates momentum context, trend structure, and comprehensive risk management.
开源脚本
秉承TradingView的精神,该脚本的作者将其开源,以便交易者可以查看和验证其功能。向作者致敬!您可以免费使用该脚本,但请记住,重新发布代码须遵守我们的网站规则。

免责声明
这些信息和出版物并非旨在提供,也不构成TradingView提供或认可的任何形式的财务、投资、交易或其他类型的建议或推荐。请阅读使用条款了解更多信息。
免责声明
这些信息和出版物并非旨在提供,也不构成TradingView提供或认可的任何形式的财务、投资、交易或其他类型的建议或推荐。请阅读使用条款了解更多信息。