OPEN-SOURCE SCRIPT
Auto Structure Lines
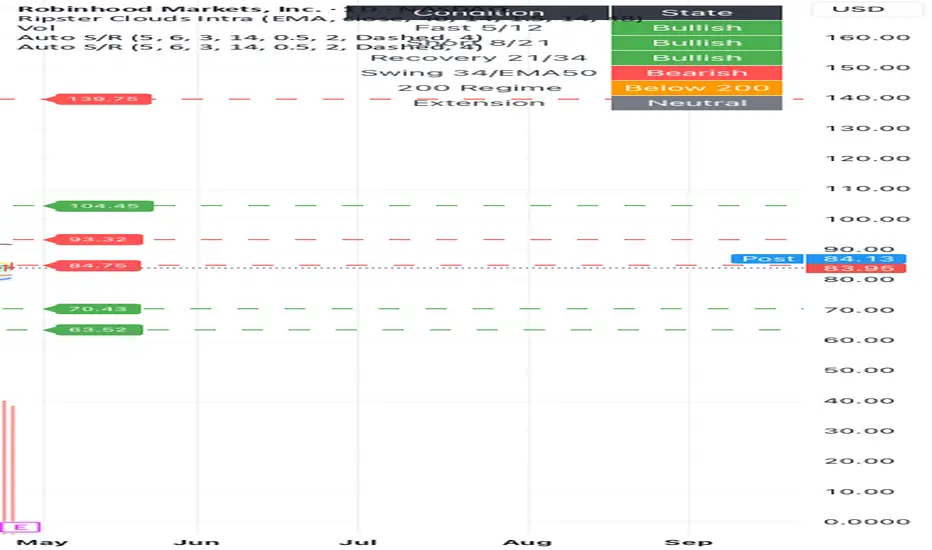
Auto Structure Lines automatically detects recent swing highs and swing lows, then plots clean support and resistance levels on the chart. It is designed to help traders quickly identify nearby structure, breakout areas, rejection zones, and possible pullback levels without manually drawing every line.
The indicator uses confirmed pivot highs and lows to create resistance and support lines. Nearby levels are merged using an ATR-based tolerance so the chart stays cleaner and avoids stacking multiple lines around the same price area.
Key features:
Automatically detects pivot-based support and resistance
Extends structure lines to the right side of the chart
Stores multiple historical levels while showing only the most recent visible levels
ATR-based level merging to reduce clutter
Optional price labels for each visible level
Customizable pivot length, line style, colors, width, and label offset
Separate toggles for support and resistance
This tool is useful for identifying important price areas, planning breakout entries, watching retests, and managing risk around nearby support or resistance.
Auto Structure Lines is a visual decision-support tool. It does not generate buy or sell signals by itself and should be used with price action, volume, trend context, and your own risk management.
开源脚本
秉承TradingView的精神,该脚本的作者将其开源,以便交易者可以查看和验证其功能。向作者致敬!您可以免费使用该脚本,但请记住,重新发布代码须遵守我们的网站规则。

免责声明
这些信息和出版物并非旨在提供,也不构成TradingView提供或认可的任何形式的财务、投资、交易或其他类型的建议或推荐。请阅读使用条款了解更多信息。
开源脚本
秉承TradingView的精神,该脚本的作者将其开源,以便交易者可以查看和验证其功能。向作者致敬!您可以免费使用该脚本,但请记住,重新发布代码须遵守我们的网站规则。
免责声明
这些信息和出版物并非旨在提供,也不构成TradingView提供或认可的任何形式的财务、投资、交易或其他类型的建议或推荐。请阅读使用条款了解更多信息。