OPEN-SOURCE SCRIPT
DIVERGENCE WAVE [ZynAlgo]
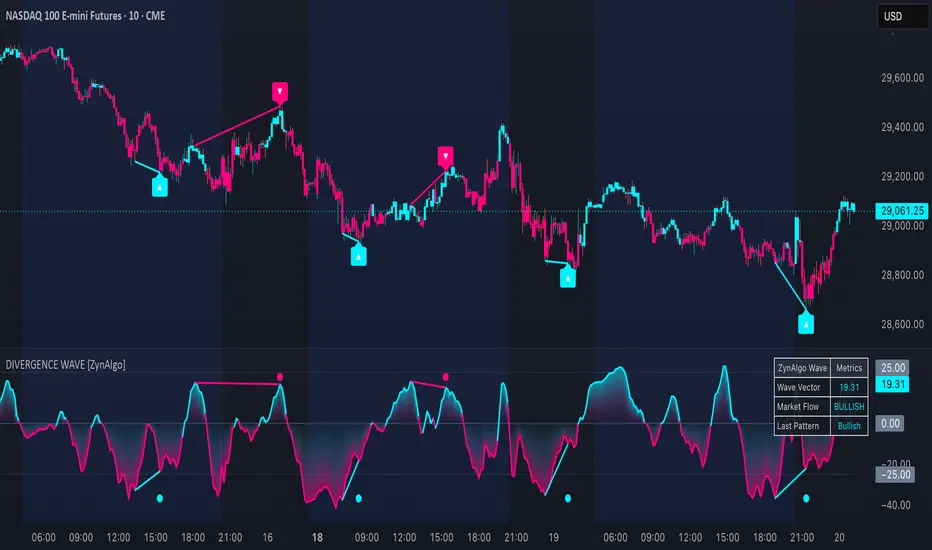
Overview
ZynAlgo DIVERGENCE WAVE is a momentum-divergence oscillator designed to analyze the relationship between directional volume pressure, internal market participation, wave-based delta momentum, and structural exhaustion behavior.
The system transforms buying and selling activity into a smoothed quantitative wave structure called the Divergence Wave. This helps traders identify:
Unlike traditional RSI or MACD divergence systems, ZynAlgo DIVERGENCE WAVE focuses on the interaction between:
This creates an adaptive interpretation of market pressure across trending and volatile environments.
Chart example:

Core System Architecture
The indicator is built around seven major components:
Each component contributes to filtering noise and improving divergence quality.
1. Quantum Delta Wave Engine
The Quantum Delta Wave Engine is the mathematical core of the system.
It evaluates:
Wave engine example:

The engine separates volume into two categories:
Bullish Volume
Volume generated when candles close bullish.
Bearish Volume
Volume generated when candles close bearish.
The system smooths both streams using EMA calculations to reduce market noise and produce a cleaner flow structure.
The final output becomes the Divergence Wave. This wave represents the current dominance between buyers and sellers.
Wave Interpretation
Positive Divergence Wave
Negative Divergence Wave
Flattening Wave
2. Critical Exhaustion Thresholds
The system uses two major exhaustion regions:
Threshold example:

ZynAlgo DIVERGENCE WAVE is a momentum-divergence oscillator designed to analyze the relationship between directional volume pressure, internal market participation, wave-based delta momentum, and structural exhaustion behavior.
The system transforms buying and selling activity into a smoothed quantitative wave structure called the Divergence Wave. This helps traders identify:
- Hidden market weakness
- Buyer or seller exhaustion
- Divergence structures
- Momentum inefficiencies
- Potential reversal regions
Unlike traditional RSI or MACD divergence systems, ZynAlgo DIVERGENCE WAVE focuses on the interaction between:
- Price expansion
- Delta participation imbalance
- Structural wave deterioration
This creates an adaptive interpretation of market pressure across trending and volatile environments.
Chart example:
Core System Architecture
The indicator is built around seven major components:
- Quantum Delta Wave Engine
- Critical Exhaustion Thresholds
- Structural Divergence Engine
- Premium Oscillator Visualization
- Overlay Signal Layer
- Metric Dashboard System
- Smart Alert Matrix
Each component contributes to filtering noise and improving divergence quality.
1. Quantum Delta Wave Engine
The Quantum Delta Wave Engine is the mathematical core of the system.
It evaluates:
- Bullish participation
- Bearish participation
- Relative volume dominance
Wave engine example:
The engine separates volume into two categories:
Bullish Volume
Volume generated when candles close bullish.
Bearish Volume
Volume generated when candles close bearish.
The system smooths both streams using EMA calculations to reduce market noise and produce a cleaner flow structure.
The final output becomes the Divergence Wave. This wave represents the current dominance between buyers and sellers.
Wave Interpretation
Positive Divergence Wave
- Buyers dominate market participation.
- Bullish pressure is increasing.
- Market momentum may support continuation.
Negative Divergence Wave
- Sellers dominate market participation.
- Bearish pressure is increasing.
- Downside pressure becomes stronger.
Flattening Wave
- Participation imbalance weakens.
- Trend momentum may be slowing.
- Potential transition or consolidation may develop.
2. Critical Exhaustion Thresholds
The system uses two major exhaustion regions:
Threshold example:
开源脚本
秉承TradingView的精神,该脚本的作者将其开源,以便交易者可以查看和验证其功能。向作者致敬!您可以免费使用该脚本,但请记住,重新发布代码须遵守我们的网站规则。

ZynAlgo — Automation trading tools & analysis. zynassets.com/l/cG3Ym
免责声明
这些信息和出版物并非旨在提供,也不构成TradingView提供或认可的任何形式的财务、投资、交易或其他类型的建议或推荐。请阅读使用条款了解更多信息。
开源脚本
秉承TradingView的精神,该脚本的作者将其开源,以便交易者可以查看和验证其功能。向作者致敬!您可以免费使用该脚本,但请记住,重新发布代码须遵守我们的网站规则。
ZynAlgo — Automation trading tools & analysis. zynassets.com/l/cG3Ym
免责声明
这些信息和出版物并非旨在提供,也不构成TradingView提供或认可的任何形式的财务、投资、交易或其他类型的建议或推荐。请阅读使用条款了解更多信息。