OPEN-SOURCE SCRIPT
options
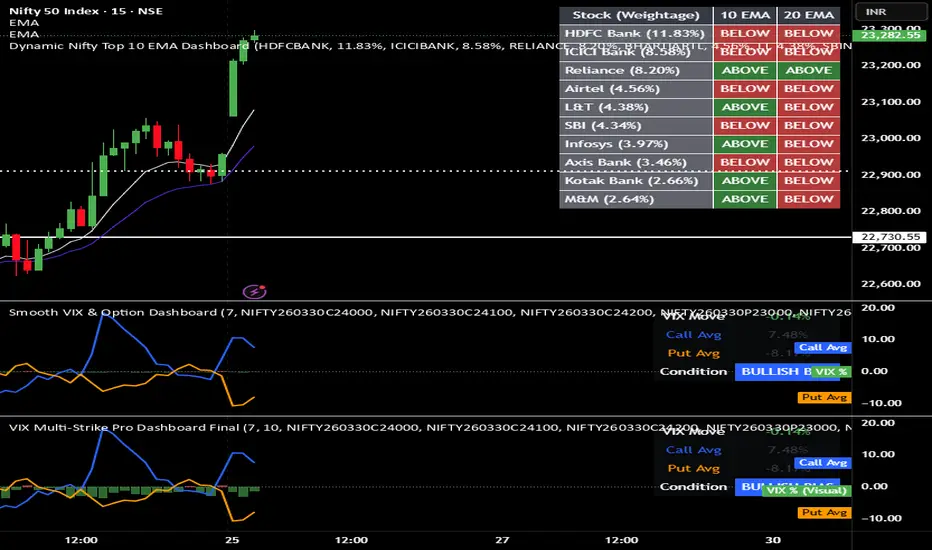
These Red and Green Bars are actually showing the status of the India VIX (Market Fear Index). Their movement up and down tells you whether "Fear" is increasing or decreasing in the market.
In simple terms, here is what they mean:
1. Red Bars (VIX is Up 📈)
* What is happening: This means the India VIX has moved higher compared to the previous candle.
* Psychology: Uncertainty or fear is rising in the market.
* Impact: When these bars are large and Red, the premiums of both Calls and Puts start to rise.
* For Sellers: This is dangerous because the options you sold are becoming more expensive (Inflating).
2. Green Bars (VIX is Down 📉)
* What is happening: This means the India VIX is falling.
* Psychology: The market is cooling down; traders are no longer feeling as much fear.
* Impact: This causes a "Vega Crush." Premiums shrink (decay) rapidly.
* For Sellers: This is "Jackpot" time. You make money from both theta decay and the drop in volatility.
Relationship Between Bars and Lines (Blue/Orange):
You simply need to look for these combinations:
* Large Red Bars + Blue/Orange Lines Up: This is a "Volatility Spike." Regardless of the direction, premiums are inflating. The chance of hitting a stop-loss is higher.
* Large Green Bars + Blue/Orange Lines Down: This is a "Vega Crush." This is the best setup for 0.3 delta selling. Even if the market stays sideways, premiums will crash toward zero quickly.
Summary Table:
| Bar Color | VIX Status | Market Mood | Option Seller (You) |
|---|---|---|---|
| RED (High) | Up | Panic/Fear | Risk: Premiums will spike. |
| GREEN (High) | Down | Relaxed | Profit: Premiums will drop fast. |
| Small Bars | Flat | Stable | Normal: You get standard Theta decay. |
In simple terms, here is what they mean:
1. Red Bars (VIX is Up 📈)
* What is happening: This means the India VIX has moved higher compared to the previous candle.
* Psychology: Uncertainty or fear is rising in the market.
* Impact: When these bars are large and Red, the premiums of both Calls and Puts start to rise.
* For Sellers: This is dangerous because the options you sold are becoming more expensive (Inflating).
2. Green Bars (VIX is Down 📉)
* What is happening: This means the India VIX is falling.
* Psychology: The market is cooling down; traders are no longer feeling as much fear.
* Impact: This causes a "Vega Crush." Premiums shrink (decay) rapidly.
* For Sellers: This is "Jackpot" time. You make money from both theta decay and the drop in volatility.
Relationship Between Bars and Lines (Blue/Orange):
You simply need to look for these combinations:
* Large Red Bars + Blue/Orange Lines Up: This is a "Volatility Spike." Regardless of the direction, premiums are inflating. The chance of hitting a stop-loss is higher.
* Large Green Bars + Blue/Orange Lines Down: This is a "Vega Crush." This is the best setup for 0.3 delta selling. Even if the market stays sideways, premiums will crash toward zero quickly.
Summary Table:
| Bar Color | VIX Status | Market Mood | Option Seller (You) |
|---|---|---|---|
| RED (High) | Up | Panic/Fear | Risk: Premiums will spike. |
| GREEN (High) | Down | Relaxed | Profit: Premiums will drop fast. |
| Small Bars | Flat | Stable | Normal: You get standard Theta decay. |
开源脚本
秉承TradingView的精神,该脚本的作者将其开源,以便交易者可以查看和验证其功能。向作者致敬!您可以免费使用该脚本,但请记住,重新发布代码须遵守我们的网站规则。

免责声明
这些信息和出版物并非旨在提供,也不构成TradingView提供或认可的任何形式的财务、投资、交易或其他类型的建议或推荐。请阅读使用条款了解更多信息。
开源脚本
秉承TradingView的精神,该脚本的作者将其开源,以便交易者可以查看和验证其功能。向作者致敬!您可以免费使用该脚本,但请记住,重新发布代码须遵守我们的网站规则。
免责声明
这些信息和出版物并非旨在提供,也不构成TradingView提供或认可的任何形式的财务、投资、交易或其他类型的建议或推荐。请阅读使用条款了解更多信息。