已更新
Quantitative Monthly Seasonality Dashboard V2
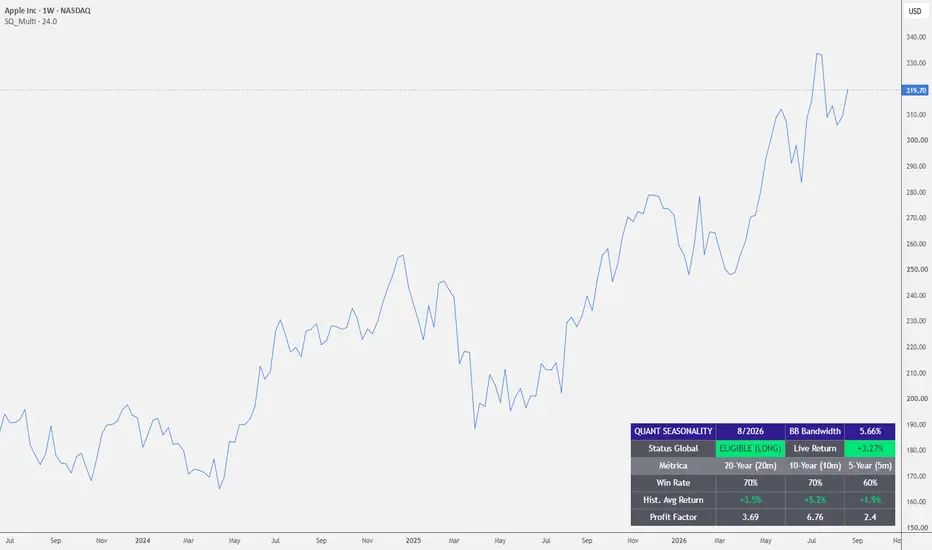
Sadashi Quant Seasonality V2 is a quantitative tool designed to evaluate the seasonal probability of any financial asset for the current calendar month, integrating volatility metrics and risk-adjusted performance data.
Unlike standard seasonal indicators, V2 evaluates both directional probability and trend quality using Bollinger Bandwidth compression filters and Profit Factor scoring, ensuring trades meet favorable risk-to-reward standards.
Key Dashboard Metrics:
Historical Win Rate: Percentage of years the asset closed positive during the current month across 20-year, 10-year, and 5-year lookback periods.
Profit Factor (PF): Ratio of total gross profits to total gross losses for the month. A PF > 1.0 confirms positive statistical asymmetry.
Hist. Avg Return: Expected average performance for the current month.
BB Bandwidth Filter: Volatility expansion/compression metric to filter out low-momentum market environments.
Global Status: Real-time trade signal (LONG / SHORT / NO TRADE) based on quantitative eligibility thresholds.
Trading Logic:
A 50% or 60% Win Rate can yield a Profit Factor of 1.5x to 2.0x if the average winning month significantly outweighs average losses, helping traders spot high-expectancy setups regardless of raw win frequency.
Developed for the Sadashi Trading community.
Unlike standard seasonal indicators, V2 evaluates both directional probability and trend quality using Bollinger Bandwidth compression filters and Profit Factor scoring, ensuring trades meet favorable risk-to-reward standards.
Key Dashboard Metrics:
Historical Win Rate: Percentage of years the asset closed positive during the current month across 20-year, 10-year, and 5-year lookback periods.
Profit Factor (PF): Ratio of total gross profits to total gross losses for the month. A PF > 1.0 confirms positive statistical asymmetry.
Hist. Avg Return: Expected average performance for the current month.
BB Bandwidth Filter: Volatility expansion/compression metric to filter out low-momentum market environments.
Global Status: Real-time trade signal (LONG / SHORT / NO TRADE) based on quantitative eligibility thresholds.
Trading Logic:
A 50% or 60% Win Rate can yield a Profit Factor of 1.5x to 2.0x if the average winning month significantly outweighs average losses, helping traders spot high-expectancy setups regardless of raw win frequency.
Developed for the Sadashi Trading community.
版本注释
Fix to monthly Live Return calculation and data capture optimization
免责声明
这些信息和出版物并非旨在提供,也不构成TradingView提供或认可的任何形式的财务、投资、交易或其他类型的建议或推荐。请阅读使用条款了解更多信息。
免责声明
这些信息和出版物并非旨在提供,也不构成TradingView提供或认可的任何形式的财务、投资、交易或其他类型的建议或推荐。请阅读使用条款了解更多信息。