LDO-Mark-SES
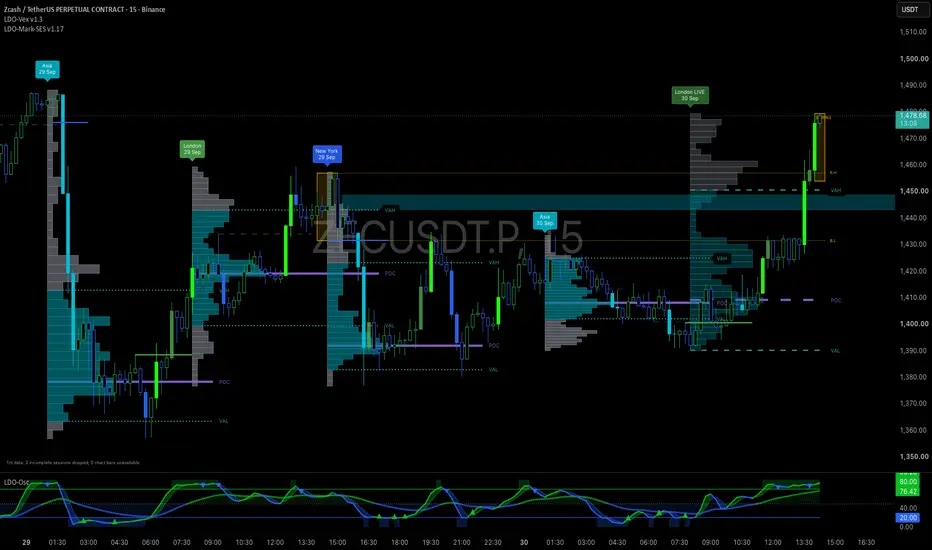
LDO-Mark-SES: Session Volume Profiles + Brinks Box
WHY IT WAS BUILT
To see at a glance where each trading session did its business: the prices where Asia, London and New York traded the most volume, and the range of the first hour of the New York open. Everything is drawn on the chart in one clean overlay.
WHAT IT SHOWS
- Session volume profiles for Asia (09:00-17:00 Tokyo), London (08:00-17:00 London) and New York (09:30-17:00 New York). Each histogram sits over its own session's candles, with a heading at the session open.
- POC (point of control): the price where the session traded the most volume.
- VAH / VAL (value area high / low): the band where about 70% of the session's volume traded.
- Live session profile: the session in progress, updated every minute. Its lines are dashed and its histogram fainter, because the levels are still moving. At the session close it is replaced by the finished profile.
- Brinks box: the high-to-low range of the first hour of the New York cash open, 09:00-10:00 New York (14:00-15:00 UK for most of the year). The previous box stays on the chart until the new one has formed. Its high and low extend to the right as lines until then, so you can compare the two.
HOW IT WORKS
- Volume at each price is estimated from 1-minute candles, spread evenly across each candle's range. It is an estimate, not tick-by-tick data.
- Session hours are set in each exchange's own time zone, so daylight-saving changes are handled automatically whatever time zone your chart uses.
- Crypto has no cash open. On crypto charts the Brinks box is drawn on the same clock as a convention.
SETTINGS
1. Sessions
- A tick box on each row shows or hides that session: Asia, London, NY.
- Each row also sets the session hours, time zone and heading colour.
- Brinks row: on/off, clock (New York 09:00-10:00 or London 14:00-15:00) and box colour.
2. Volume profile
- Histograms on/off, live session profile on/off, and how many past sessions to keep.
- Price rows, value area %, position (over the session, or beside its close) and width.
- Colours inside and outside the value area, and transparency for finished and live profiles.
3. POC / VAH / VAL lines
- Colour, line type and thickness for each line.
- Tags on/off and tag size.
- Optionally extend each POC to the right until price touches it.
4. Brinks box
- Border thickness, fill colour and opacity.
- Extend high & low lines on/off, plus their colour, line type and thickness.
- Text colour, and optional B.H / B.L tags for the Brinks high and low.
5. Advanced
- Calculation depth and label placement. The defaults suit most charts.
REQUIREMENTS
- Intraday charts of 1 minute or higher, with standard candles.
- The Brinks box draws on timeframes that divide an hour evenly (1, 3, 5, 15, 30 and 60 minutes). On 15m it is exactly four candles.
- A small note at the bottom left reports any session skipped because 1-minute history did not cover it completely. This is normal for the oldest session on the chart..
WHY IT WAS BUILT
To see at a glance where each trading session did its business: the prices where Asia, London and New York traded the most volume, and the range of the first hour of the New York open. Everything is drawn on the chart in one clean overlay.
WHAT IT SHOWS
- Session volume profiles for Asia (09:00-17:00 Tokyo), London (08:00-17:00 London) and New York (09:30-17:00 New York). Each histogram sits over its own session's candles, with a heading at the session open.
- POC (point of control): the price where the session traded the most volume.
- VAH / VAL (value area high / low): the band where about 70% of the session's volume traded.
- Live session profile: the session in progress, updated every minute. Its lines are dashed and its histogram fainter, because the levels are still moving. At the session close it is replaced by the finished profile.
- Brinks box: the high-to-low range of the first hour of the New York cash open, 09:00-10:00 New York (14:00-15:00 UK for most of the year). The previous box stays on the chart until the new one has formed. Its high and low extend to the right as lines until then, so you can compare the two.
HOW IT WORKS
- Volume at each price is estimated from 1-minute candles, spread evenly across each candle's range. It is an estimate, not tick-by-tick data.
- Session hours are set in each exchange's own time zone, so daylight-saving changes are handled automatically whatever time zone your chart uses.
- Crypto has no cash open. On crypto charts the Brinks box is drawn on the same clock as a convention.
SETTINGS
1. Sessions
- A tick box on each row shows or hides that session: Asia, London, NY.
- Each row also sets the session hours, time zone and heading colour.
- Brinks row: on/off, clock (New York 09:00-10:00 or London 14:00-15:00) and box colour.
2. Volume profile
- Histograms on/off, live session profile on/off, and how many past sessions to keep.
- Price rows, value area %, position (over the session, or beside its close) and width.
- Colours inside and outside the value area, and transparency for finished and live profiles.
3. POC / VAH / VAL lines
- Colour, line type and thickness for each line.
- Tags on/off and tag size.
- Optionally extend each POC to the right until price touches it.
4. Brinks box
- Border thickness, fill colour and opacity.
- Extend high & low lines on/off, plus their colour, line type and thickness.
- Text colour, and optional B.H / B.L tags for the Brinks high and low.
5. Advanced
- Calculation depth and label placement. The defaults suit most charts.
REQUIREMENTS
- Intraday charts of 1 minute or higher, with standard candles.
- The Brinks box draws on timeframes that divide an hour evenly (1, 3, 5, 15, 30 and 60 minutes). On 15m it is exactly four candles.
- A small note at the bottom left reports any session skipped because 1-minute history did not cover it completely. This is normal for the oldest session on the chart..

免责声明
这些信息和出版物并非旨在提供,也不构成TradingView提供或认可的任何形式的财务、投资、交易或其他类型的建议或推荐。请阅读使用条款了解更多信息。