OPEN-SOURCE SCRIPT
Zero-Lag MACD Divergence Pro
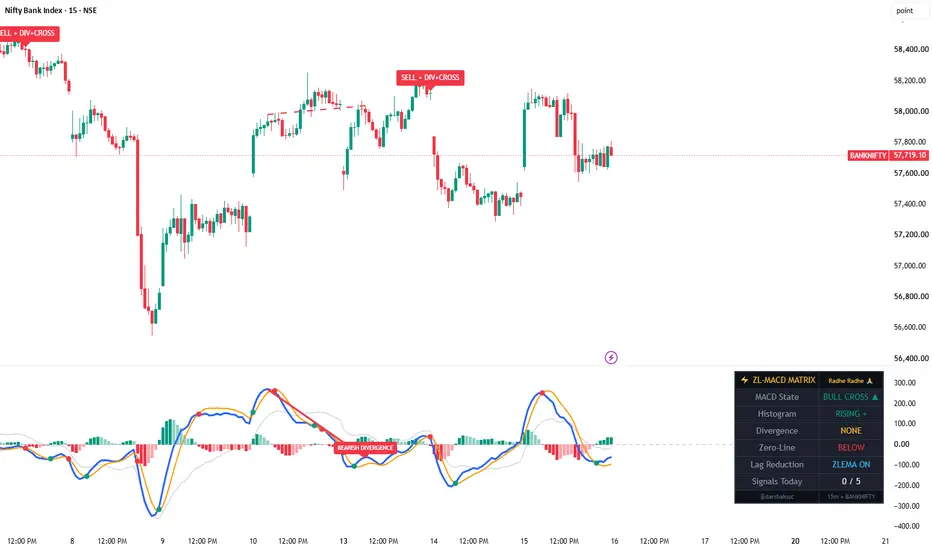
Zero-Lag MACD Divergence Pro is a MACD-family oscillator that reduces the indicator's inherent lag using zero-lag exponential averaging, detects regular divergences directly inside the MACD pane, and optionally gates its buy/sell markers so they only appear when a divergence and a crossover confirm each other. It is designed for intraday timeframes but works on any chart.
What makes it original
This is not a standard MACD with cosmetic changes. Three elements work as one system: (1) all three components — fast line, slow line, and signal line — are rebuilt on zero-lag EMAs rather than standard EMAs, (2) divergence detection runs on the zero-lag MACD line itself and draws its lines and labels inside the oscillator pane, with an optional mirrored dashed line on the price chart, and (3) a combo-gating mode suppresses crossover markers unless a divergence was confirmed within a recent, user-defined window, which filters the many insignificant crossovers a MACD produces in ranging markets.
How it works
Zero-Lag Core: Each component uses the zero-lag EMA construction (2 × EMA − EMA of EMA), a public-domain technique attributed to John Ehlers' error-correction work. This roughly halves the effective lag of each average, so crossovers occur earlier than on a classic MACD. A faded classic MACD line can be displayed for side-by-side comparison and switched off in the settings.
Divergence Detection: Confirmed pivot highs/lows on the zero-lag MACD line are compared with price highs/lows at the same bars. A regular bullish divergence (price lower low, MACD higher low) or regular bearish divergence (price higher high, MACD lower high) draws a connecting line between the two MACD pivots with a label in the pane. Pivots confirm only after the lookback period elapses, so divergence lines appear with a delay by design and do not repaint.
Combo Signals: In the default mode, a buy/sell marker prints on the price chart only when a zero-lag crossover occurs while a same-direction divergence is still valid (within a user-defined number of bars). Turning combo mode off prints markers on every confirmed crossover instead. Signals respect a cooldown and a daily maximum.
Four-Color Histogram: The histogram distinguishes rising and fading momentum on both sides of the zero line.
Dashboard: A dark, movable panel (styled to stay readable on light-theme charts) summarizes MACD state, histogram direction, active divergence, zero-line position, and the day's signal count.
How to use it
Add the indicator to a lower-timeframe chart (5–15 min for intraday use). Watch for a divergence label in the pane, then wait for the crossover marker that confirms it — the combo mode automates exactly this sequence. The zero-line row on the dashboard helps grade signals: bullish setups above the zero line and bearish setups below it occur in the direction of the broader momentum. All lengths, the divergence window, signal limits, colors, and dashboard placement are adjustable.
Limitations
Divergence lines appear only after pivots confirm (default 5 bars), so they are visible later than the pivot itself; this is the unavoidable cost of non-repainting detection. Reduced lag also means the zero-lag lines are more sensitive than a classic MACD and can produce more crossovers in choppy conditions — the combo mode exists to filter these. This tool describes momentum conditions; it does not predict future price movement, and past behavior of any signal does not guarantee future results. Always combine with your own analysis and risk management.
What makes it original
This is not a standard MACD with cosmetic changes. Three elements work as one system: (1) all three components — fast line, slow line, and signal line — are rebuilt on zero-lag EMAs rather than standard EMAs, (2) divergence detection runs on the zero-lag MACD line itself and draws its lines and labels inside the oscillator pane, with an optional mirrored dashed line on the price chart, and (3) a combo-gating mode suppresses crossover markers unless a divergence was confirmed within a recent, user-defined window, which filters the many insignificant crossovers a MACD produces in ranging markets.
How it works
Zero-Lag Core: Each component uses the zero-lag EMA construction (2 × EMA − EMA of EMA), a public-domain technique attributed to John Ehlers' error-correction work. This roughly halves the effective lag of each average, so crossovers occur earlier than on a classic MACD. A faded classic MACD line can be displayed for side-by-side comparison and switched off in the settings.
Divergence Detection: Confirmed pivot highs/lows on the zero-lag MACD line are compared with price highs/lows at the same bars. A regular bullish divergence (price lower low, MACD higher low) or regular bearish divergence (price higher high, MACD lower high) draws a connecting line between the two MACD pivots with a label in the pane. Pivots confirm only after the lookback period elapses, so divergence lines appear with a delay by design and do not repaint.
Combo Signals: In the default mode, a buy/sell marker prints on the price chart only when a zero-lag crossover occurs while a same-direction divergence is still valid (within a user-defined number of bars). Turning combo mode off prints markers on every confirmed crossover instead. Signals respect a cooldown and a daily maximum.
Four-Color Histogram: The histogram distinguishes rising and fading momentum on both sides of the zero line.
Dashboard: A dark, movable panel (styled to stay readable on light-theme charts) summarizes MACD state, histogram direction, active divergence, zero-line position, and the day's signal count.
How to use it
Add the indicator to a lower-timeframe chart (5–15 min for intraday use). Watch for a divergence label in the pane, then wait for the crossover marker that confirms it — the combo mode automates exactly this sequence. The zero-line row on the dashboard helps grade signals: bullish setups above the zero line and bearish setups below it occur in the direction of the broader momentum. All lengths, the divergence window, signal limits, colors, and dashboard placement are adjustable.
Limitations
Divergence lines appear only after pivots confirm (default 5 bars), so they are visible later than the pivot itself; this is the unavoidable cost of non-repainting detection. Reduced lag also means the zero-lag lines are more sensitive than a classic MACD and can produce more crossovers in choppy conditions — the combo mode exists to filter these. This tool describes momentum conditions; it does not predict future price movement, and past behavior of any signal does not guarantee future results. Always combine with your own analysis and risk management.
开源脚本
秉承TradingView的精神,该脚本的作者将其开源,以便交易者可以查看和验证其功能。向作者致敬!您可以免费使用该脚本,但请记住,重新发布代码须遵守我们的网站规则。

免责声明
这些信息和出版物并非旨在提供,也不构成TradingView提供或认可的任何形式的财务、投资、交易或其他类型的建议或推荐。请阅读使用条款了解更多信息。
开源脚本
秉承TradingView的精神,该脚本的作者将其开源,以便交易者可以查看和验证其功能。向作者致敬!您可以免费使用该脚本,但请记住,重新发布代码须遵守我们的网站规则。
免责声明
这些信息和出版物并非旨在提供,也不构成TradingView提供或认可的任何形式的财务、投资、交易或其他类型的建议或推荐。请阅读使用条款了解更多信息。