OPEN-SOURCE SCRIPT
Liquidity gap identifier mtf
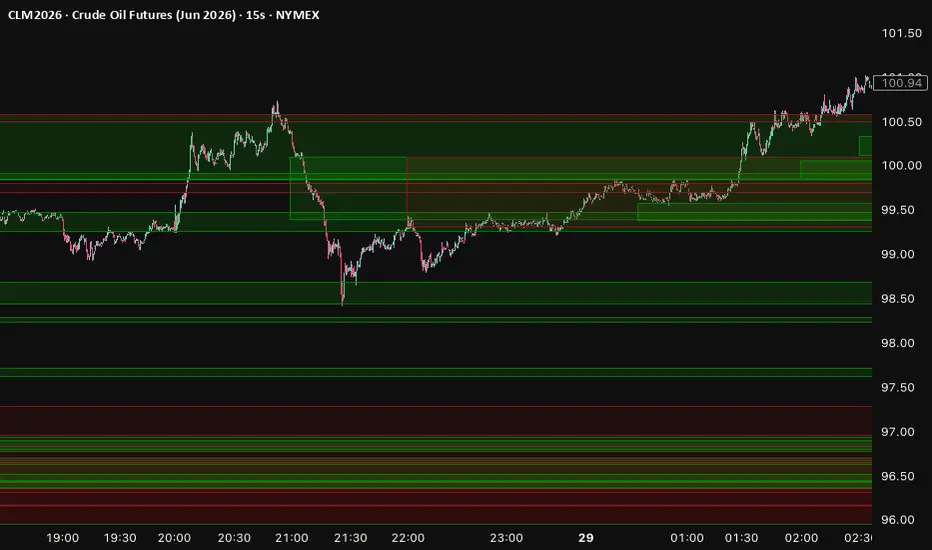
This Pine Script v6 indicator called "Liquidity gap identifier mtf" detects and visually highlights price gaps (also known as imbalances, inefficiencies, or Fair Value Gaps in SMC/ICT trading) using multi-timeframe (MTF) support.How it works:It compares the current candle (or higher timeframe candle) with the candle two bars prior.
Bullish Gap (upward imbalance): When the low of the current candle is higher than the high of the candle from two bars ago (low > high[2]). This leaves an unfilled area below price.
Bearish Gap (downward imbalance): When the high of the current candle is lower than the low of the candle from two bars ago (high < low[2]). This leaves an unfilled area above price.
The script draws boxes (rectangles) to mark these gaps:Boxes start between the relevant candles and automatically expand to the right (to the current bar) as new bars form.
Supports MTF: You can display gaps from a higher timeframe (e.g., daily gaps on a 15-minute chart) while keeping the main chart clean.
Customization: Colors, transparency, and the option to hide filled gaps (when price trades through the gap, the box is removed).
Uses arrays for efficient management of multiple active boxes with a FIFO (first-in, first-out) limit to avoid exceeding TradingView's max_boxes_count.
Key FeaturesExpanding boxes — The gaps stay visible and stretch rightward until filled or the max limit is reached.
Auto cleanup — Removes oldest gaps when the user-defined max is hit.
Hide filled gaps option (very useful for clean charts).
Clean MTF implementation using request.security() with proper gap handling.
Main Use CasesFair Value Gap / Imbalance Trading (ICT/SMC)Many traders use these gaps as magnet zones or areas that price is likely to return to and "fill" (mitigate).
Bullish gaps often act as support; bearish gaps as resistance.
Multi-Timeframe ConfluencePlot higher-timeframe gaps on your lower-timeframe chart to see where larger players might have left inefficiencies.
Example: Show 4H or Daily liquidity gaps while scalping on 5m/15m.
Gap Fill StrategiesEnter trades expecting price to retrace and fill the gap (mean reversion).
Or use unfilled gaps as bias: Trade in the direction of the gap (continuation) until it fills.
Liquidity Void IdentificationThese gaps represent areas with low liquidity / rapid price movement. Institutions often target or avoid them, making them useful for stop hunts, order blocks, or breaker setups.
Clean Chart ManagementThe "Hide Filled Gaps" feature + max boxes limit keeps the chart from becoming cluttered with old, irrelevant zones.
Typical Trading ContextTraders combine this with:Order blocks / breaker blocks
Market structure (BOS/CHOCH)
Volume profile or session liquidity
Higher-timeframe bias
Bullish Gap (upward imbalance): When the low of the current candle is higher than the high of the candle from two bars ago (low > high[2]). This leaves an unfilled area below price.
Bearish Gap (downward imbalance): When the high of the current candle is lower than the low of the candle from two bars ago (high < low[2]). This leaves an unfilled area above price.
The script draws boxes (rectangles) to mark these gaps:Boxes start between the relevant candles and automatically expand to the right (to the current bar) as new bars form.
Supports MTF: You can display gaps from a higher timeframe (e.g., daily gaps on a 15-minute chart) while keeping the main chart clean.
Customization: Colors, transparency, and the option to hide filled gaps (when price trades through the gap, the box is removed).
Uses arrays for efficient management of multiple active boxes with a FIFO (first-in, first-out) limit to avoid exceeding TradingView's max_boxes_count.
Key FeaturesExpanding boxes — The gaps stay visible and stretch rightward until filled or the max limit is reached.
Auto cleanup — Removes oldest gaps when the user-defined max is hit.
Hide filled gaps option (very useful for clean charts).
Clean MTF implementation using request.security() with proper gap handling.
Main Use CasesFair Value Gap / Imbalance Trading (ICT/SMC)Many traders use these gaps as magnet zones or areas that price is likely to return to and "fill" (mitigate).
Bullish gaps often act as support; bearish gaps as resistance.
Multi-Timeframe ConfluencePlot higher-timeframe gaps on your lower-timeframe chart to see where larger players might have left inefficiencies.
Example: Show 4H or Daily liquidity gaps while scalping on 5m/15m.
Gap Fill StrategiesEnter trades expecting price to retrace and fill the gap (mean reversion).
Or use unfilled gaps as bias: Trade in the direction of the gap (continuation) until it fills.
Liquidity Void IdentificationThese gaps represent areas with low liquidity / rapid price movement. Institutions often target or avoid them, making them useful for stop hunts, order blocks, or breaker setups.
Clean Chart ManagementThe "Hide Filled Gaps" feature + max boxes limit keeps the chart from becoming cluttered with old, irrelevant zones.
Typical Trading ContextTraders combine this with:Order blocks / breaker blocks
Market structure (BOS/CHOCH)
Volume profile or session liquidity
Higher-timeframe bias
开源脚本
秉承TradingView的精神,该脚本的作者将其开源,以便交易者可以查看和验证其功能。向作者致敬!您可以免费使用该脚本,但请记住,重新发布代码须遵守我们的网站规则。

免责声明
这些信息和出版物并非旨在提供,也不构成TradingView提供或认可的任何形式的财务、投资、交易或其他类型的建议或推荐。请阅读使用条款了解更多信息。
开源脚本
秉承TradingView的精神,该脚本的作者将其开源,以便交易者可以查看和验证其功能。向作者致敬!您可以免费使用该脚本,但请记住,重新发布代码须遵守我们的网站规则。
免责声明
这些信息和出版物并非旨在提供,也不构成TradingView提供或认可的任何形式的财务、投资、交易或其他类型的建议或推荐。请阅读使用条款了解更多信息。