OPEN-SOURCE SCRIPT
已更新 Entry Gate - ADR% / ADV / ATR Multiple
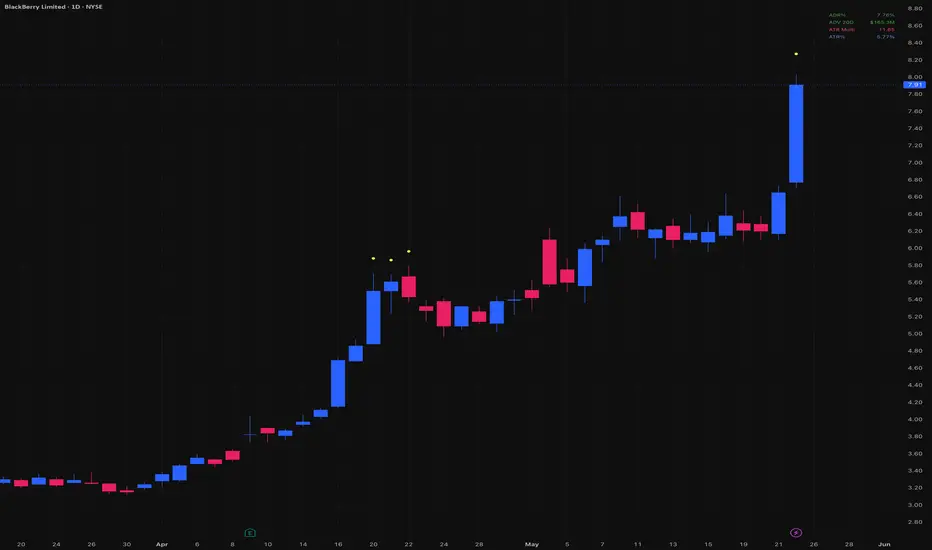
Three critical pre-trade filters, always visible right on your chart.
Before entering any swing trade, three questions determine whether the setup is even worth considering: is this stock volatile enough to move my account, is it liquid enough to trade cleanly, and is it too extended to enter now? Entry Gate answers all three at a glance, in a single corner of your chart.
All values are color-coded against your thresholds:
🟢 Green — within your ideal range
🟠 Orange — borderline, proceed with caution
🔴 Red — outside your criteria
A yellow dot also plots above the bar when the ATR Multiple exceeds your trigger level, marking historically extended zones at a glance.
Fully customizable:
All values are pulled from the daily timeframe via request.security, so the numbers stay consistent whether you're on a daily, weekly, or intraday chart.
Default thresholds are calibrated for swing traders running mid-sized accounts. Adjust to match your strategy.
Credits to ArmerSchlucker for the original ADR% table indicator, MikeC / TheScrutiniser and GlinckEastwoot for the ADR% formula, and jfsrev / Fred6724 for the ATR% Multiple from 50-MA approach.
Before entering any swing trade, three questions determine whether the setup is even worth considering: is this stock volatile enough to move my account, is it liquid enough to trade cleanly, and is it too extended to enter now? Entry Gate answers all three at a glance, in a single corner of your chart.
- ADR% (Average Daily Range) measures how much a stock moves on an average day. Too low and it won't move your portfolio. Too high and daily noise will stop you out randomly.
- ADV (Average Dollar Volume) measures how much money flows through the stock each day. Liquid stocks respect key levels, pull back cleanly to moving averages, and don't gap on low volume. Illiquid stocks do the opposite.
- ATR Multiple measures how extended the price is above its 50-day moving average, expressed in ATR units. The further extended, the higher the probability of a pause or reversal. Based on jfsrev's published formula: % Gain from MA divided by ATR%.
- ATR% rounds out the dashboard with the raw volatility number for context.
All values are color-coded against your thresholds:
🟢 Green — within your ideal range
🟠 Orange — borderline, proceed with caution
🔴 Red — outside your criteria
A yellow dot also plots above the bar when the ATR Multiple exceeds your trigger level, marking historically extended zones at a glance.
Fully customizable:
- Independent thresholds for ADR%, ADV, and ATR Multiple
- Warning zones for borderline values
- Lookback periods for each calculation
- Font size, table position, dot size and offset
- Color customization for good / warning / bad / ATR / dot
All values are pulled from the daily timeframe via request.security, so the numbers stay consistent whether you're on a daily, weekly, or intraday chart.
Default thresholds are calibrated for swing traders running mid-sized accounts. Adjust to match your strategy.
Credits to ArmerSchlucker for the original ADR% table indicator, MikeC / TheScrutiniser and GlinckEastwoot for the ADR% formula, and jfsrev / Fred6724 for the ATR% Multiple from 50-MA approach.
版本注释
Updated so it still shows on weekly charts. However, keep in mind that it's showing daily values.开源脚本
秉承TradingView的精神,该脚本的作者将其开源,以便交易者可以查看和验证其功能。向作者致敬!您可以免费使用该脚本,但请记住,重新发布代码须遵守我们的网站规则。

免责声明
这些信息和出版物并非旨在提供,也不构成TradingView提供或认可的任何形式的财务、投资、交易或其他类型的建议或推荐。请阅读使用条款了解更多信息。
免责声明
这些信息和出版物并非旨在提供,也不构成TradingView提供或认可的任何形式的财务、投资、交易或其他类型的建议或推荐。请阅读使用条款了解更多信息。