OPEN-SOURCE SCRIPT
Up/Dn Volume Sentiment Strategy
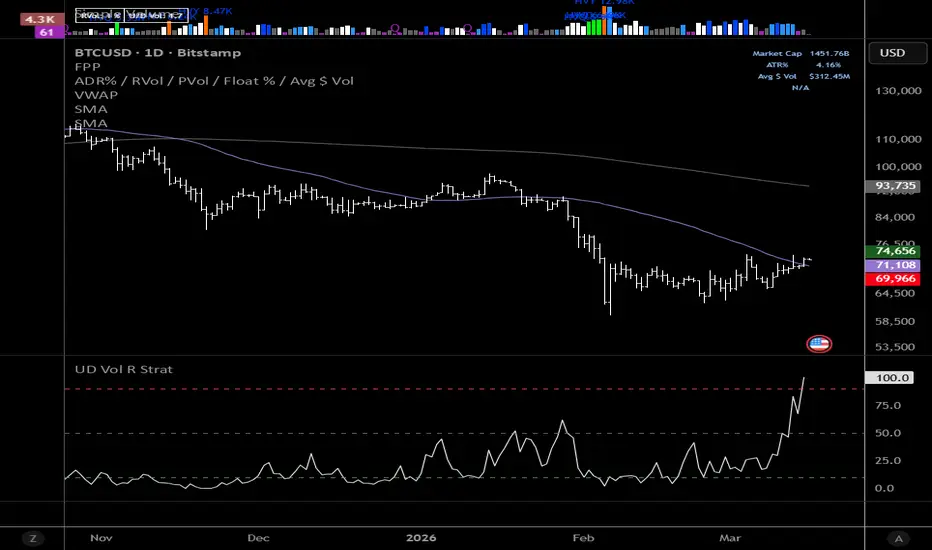
**Volume Sentiment Oscillator Strategy (Up/Down Volume, Mean Reversion, R-Multiple Risk Management)**
This strategy converts the Up/Down Volume Ratio into a normalized sentiment oscillator designed to identify potential exhaustion in buying or selling pressure. The idea is that when trading volume becomes heavily skewed toward one side of the market, sentiment may be reaching an extreme that can lead to a reversal or mean-reversion move.
The script calculates buying pressure as the volume occurring on bars that close higher than the previous bar, and selling pressure as the volume occurring on bars that close lower. These values are smoothed and converted into an Up/Down Volume Ratio. That ratio is then normalized over a configurable historical range (default: three years) to produce a **0–100 sentiment oscillator**.
This normalization allows traders to quickly see when the current level of buying or selling pressure is historically extreme.
**Strategy logic**
• Long positions open when the sentiment oscillator drops below a configurable oversold threshold (default: 10).
• Short positions open when the oscillator rises above a configurable overbought threshold (default: 90).
These thresholds represent situations where participation becomes heavily one-sided.
**Risk management**
Risk is defined as a percentage distance from the entry price (default: 5%).
Profit targets are expressed in **R multiples**, where:
• 1R = the distance from entry to stop loss
• 2R = twice the stop distance
• 3R = three times the stop distance
Using R-based exits allows traders to experiment with different reward-to-risk profiles and analyze how exit logic affects the system's expectancy.
**Configurable inputs**
• Up/Down volume smoothing length
• Normalization lookback period
• Long entry threshold
• Short entry threshold
• Stop-loss percentage
• Profit target (R multiple)
**Use cases**
This strategy can be used as a research tool to study how extreme participation levels influence price behavior. It may be applied across stocks, indexes, and other liquid markets to evaluate mean-reversion tendencies driven by volume imbalance.
As with any systematic model, traders should test across multiple markets and timeframes to understand its strengths and limitations.
This strategy converts the Up/Down Volume Ratio into a normalized sentiment oscillator designed to identify potential exhaustion in buying or selling pressure. The idea is that when trading volume becomes heavily skewed toward one side of the market, sentiment may be reaching an extreme that can lead to a reversal or mean-reversion move.
The script calculates buying pressure as the volume occurring on bars that close higher than the previous bar, and selling pressure as the volume occurring on bars that close lower. These values are smoothed and converted into an Up/Down Volume Ratio. That ratio is then normalized over a configurable historical range (default: three years) to produce a **0–100 sentiment oscillator**.
This normalization allows traders to quickly see when the current level of buying or selling pressure is historically extreme.
**Strategy logic**
• Long positions open when the sentiment oscillator drops below a configurable oversold threshold (default: 10).
• Short positions open when the oscillator rises above a configurable overbought threshold (default: 90).
These thresholds represent situations where participation becomes heavily one-sided.
**Risk management**
Risk is defined as a percentage distance from the entry price (default: 5%).
Profit targets are expressed in **R multiples**, where:
• 1R = the distance from entry to stop loss
• 2R = twice the stop distance
• 3R = three times the stop distance
Using R-based exits allows traders to experiment with different reward-to-risk profiles and analyze how exit logic affects the system's expectancy.
**Configurable inputs**
• Up/Down volume smoothing length
• Normalization lookback period
• Long entry threshold
• Short entry threshold
• Stop-loss percentage
• Profit target (R multiple)
**Use cases**
This strategy can be used as a research tool to study how extreme participation levels influence price behavior. It may be applied across stocks, indexes, and other liquid markets to evaluate mean-reversion tendencies driven by volume imbalance.
As with any systematic model, traders should test across multiple markets and timeframes to understand its strengths and limitations.
开源脚本
秉承TradingView的精神,该脚本的作者将其开源,以便交易者可以查看和验证其功能。向作者致敬!您可以免费使用该脚本,但请记住,重新发布代码须遵守我们的网站规则。

免责声明
这些信息和出版物并非旨在提供,也不构成TradingView提供或认可的任何形式的财务、投资、交易或其他类型的建议或推荐。请阅读使用条款了解更多信息。
开源脚本
秉承TradingView的精神,该脚本的作者将其开源,以便交易者可以查看和验证其功能。向作者致敬!您可以免费使用该脚本,但请记住,重新发布代码须遵守我们的网站规则。
免责声明
这些信息和出版物并非旨在提供,也不构成TradingView提供或认可的任何形式的财务、投资、交易或其他类型的建议或推荐。请阅读使用条款了解更多信息。