OPEN-SOURCE SCRIPT
已更新 Candle Pattern Forecast
# Candle Pattern Forecast — Complete Guide
---
## What This Indicator Does
The Candle Pattern Forecast engine looks at the most recent candles on your chart and asks a simple question: **has the market made this same sequence of candles before, and if so, what happened next?**
Every candle tells a story beyond just where price closed. It reveals how decisive the move was (the body), whether buyers or sellers got rejected at the extremes (the wicks), and which side was in control (direction). This indicator reads those four characteristics on each of the last N candles, builds a structural fingerprint of that sequence, then scans back through history looking for every other time the market made a similar sequence.
Once it finds enough matching sequences, it looks at what price actually did in the bars that followed each match. It then plots the median of all those outcomes as a forecast midline, and draws confidence bands showing the range where the bulk of those historical outcomes actually landed.
In plain terms: **the last time the market made candles that looked like this, here is what typically happened next.**
---
## What It Is Not
This is not a crystal ball. It is not predicting the future with certainty. It is showing you a probability-weighted summary of historical behavior following similar candle patterns. The quality of that summary depends entirely on how many good matches exist in history and how consistently those matches behaved afterward. The info box tells you both of those things in real time.
---
## The Display
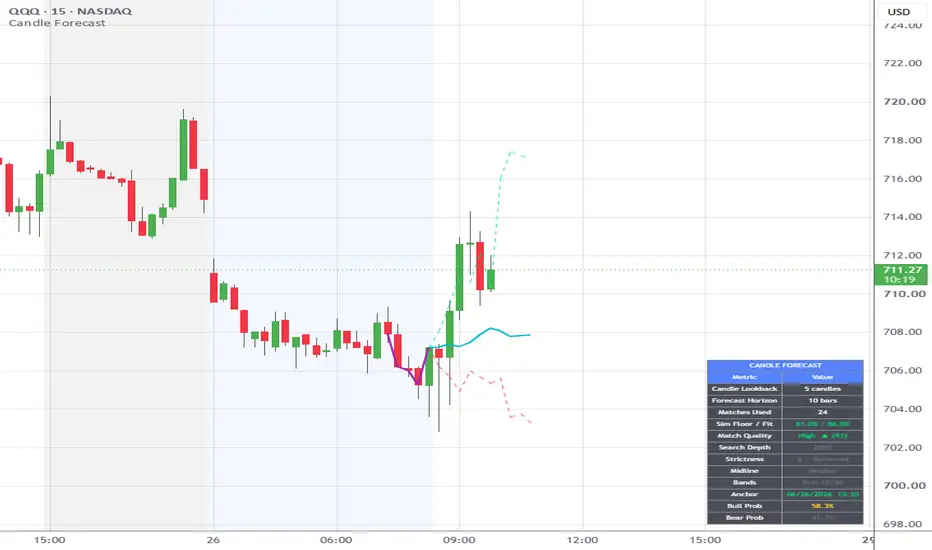
**Pattern Line** — a purple line tracing the closes of the Candle Lookback window. This shows you exactly which candles the engine read to build its fingerprint, ending at the anchor point where the forecast begins. When Historical Rewind is active, the pattern line shifts back with the rest of the indicator so you always see the sequence that generated the projection.
**Forecast Midline** — the median (or average, if you switch modes) of all the forward price paths observed after matched candle sequences. This is your central tendency line — where the market most commonly ended up after patterns like this.
**Confidence Bands** — the range between the 25th and 75th percentile of historical outcomes by default. The middle 50% of your matched sequences ended up inside these bands. Tight bands mean the matches behaved consistently. Wide bands mean outcomes were scattered and the pattern had no reliable follow-through.
The bands naturally widen as they extend further forward in time. This is correct behavior — the further out you project, the more historical paths diverge from each other.
---
## Inputs — Model Group
**Non-Repaint Mode** — when on, the indicator anchors itself to the last fully closed candle and never changes its projection mid-bar. This is the honest setting for real trading decisions. When off, it updates live on the current bar, which means the projection shifts as price moves.
**Candle Lookback** — how many candles back the engine reads to build its fingerprint. At 5, it reads the last 5 candles and uses their combined anatomy as the pattern it is trying to match in history. Shorter lookbacks find more matches because the fingerprint is simpler. Longer lookbacks find fewer but potentially more specific matches. For short-term intraday work, 3–7 is a practical range. Going much above 10–15 starts to starve the engine of good matches.
**Search Depth** — how far back in history the engine scans looking for matches, measured in bars. At 2000, it looks back 2000 bars. More depth gives more candidates to match against, which is generally better. The limit is how much data your chart actually has.
**Forecast Horizon** — how many bars forward the projection extends after the anchor point. At 10, you get a 10-bar forecast. Keep this in a sensible relationship to your Candle Lookback — projecting 50 bars forward on a 5-candle pattern will produce a technically valid but practically meaningless result as the historical outcomes diverge too much to average meaningfully.
**Pattern Matches** — the target number of historical matches the engine tries to collect. It starts with a very strict similarity requirement and automatically loosens it until it has found this many matches, stopping at the Similarity Floor. More matches produce a smoother, more stable midline but dilute the directional signal. Fewer matches are noisier but more specific. 15–30 is a practical range.
**Similarity Floor** — the absolute minimum similarity score the engine will accept for a match, expressed as a percentage. If it cannot find enough matches above this floor, it takes whatever it found and shows a warning in the info box. This prevents the engine from building a projection on essentially unrelated historical patterns. Raising this makes the engine more selective. Lowering it makes it more permissive.
---
## Inputs — Historical Rewind Group
**Enable Rewind** — when toggled on, the entire indicator shifts backward in time by the number of bars you specify. The fingerprint is read from that past point, the scan searches only history that existed at that time, and the projection extends forward from there — into what is now known history. This lets you visually compare what the indicator would have projected against what price actually did. The pattern line also shifts back to show the candle sequence that was read at that point in time. When off, the indicator runs live as normal.
**Bars Back** — how many bars back to anchor the rewind. At 50, the engine reads the candle sequence from 50 bars ago, finds matches from history prior to that point, and draws the projection forward from there. You can then see how closely the actual subsequent price action followed the forecast. Set to 0 when rewind is enabled but you want to temporarily pause without toggling it off.
The info box Rewind row shows **Live** when rewind is off and **⏪ N bars back** in orange when active, so it is always clear whether you are looking at a live projection or a historical replay.
---
## Inputs — Match Strictness Group
**Match Strictness** — a single dropdown from 1 (Weak) to 5 (Exact) that controls how the engine weighs the four candle anatomy dimensions against each other when measuring similarity.
- **1 — Weak** — all four dimensions (body, upper wick, lower wick, direction) matter equally. The engine is looking for a general structural resemblance. Finds the most matches.
- **2 — Relaxed** — slight emphasis on body conviction. Still broadly permissive.
- **3 — Balanced** — the default. Body size is the dominant signal but wicks and direction still contribute meaningfully.
- **4 — Strict** — strong body emphasis. The engine is primarily matching on how decisive each candle was. Fewer but structurally closer matches.
- **5 — Exact** — body conviction is the overwhelming signal. Only candle sequences with very similar body profiles will qualify. Hardest to match, fewest results.
Think of this as tuning what kind of candle similarity matters most to you. If you care primarily about whether candles were indecisive or committed, lean toward Strict or Exact. If you want a broader match that respects the full candle structure equally, use Weak or Relaxed.
---
## Inputs — Pattern Line Group
**Show Pattern Line** — toggles the pattern line on or off. Default is on.
**Color** — color of the pattern line. Default is purple.
**Width** — thickness of the pattern line. Default is 2.
---
## Inputs — Forecast Group
**Midline Mode** — controls how the central forecast line is calculated from the matched outcomes.
- **Median** (default) — takes the middle value when all outcomes are sorted. More robust to outliers. If one matched sequence had a massive move that was atypical, it gets pushed to the edge rather than pulling the midline toward it.
- **Average** — takes the arithmetic mean of all outcomes. More sensitive to outliers and extreme moves in either direction.
For most use cases Median is the more honest representation of what typically happened.
**Midline Color / Width / Style** — visual styling for the forecast midline.
**Show Confidence Bands** — toggles the upper and lower bands on or off.
**Confidence Band Mode** — controls how the bands are calculated.
- **Percentile** (default) — sorts all historical outcomes at each forecast step and draws the bands at the exact percentile you specify. No assumptions about the shape of the distribution. The bands directly show you where real historical outcomes clustered.
- **Std Deviation** — draws the bands at mean ± N standard deviations. Assumes outcomes are roughly bell-shaped. Can be distorted by outliers inflating the standard deviation even when most matches behaved similarly.
**Lower Percentile / Upper Percentile** — only active in Percentile mode. Default is 25 and 75, meaning the bands show where the middle 50% of historical outcomes landed. Moving to 10/90 widens the bands to capture 80% of outcomes. Moving to 5/95 captures 90%. The right setting depends on whether you want to see the typical range or the full plausible range.
**Band Std Deviation** — only active in Std Deviation mode. At 1.0, the bands cover approximately 68% of outcomes. At 2.0, approximately 95%.
**Upper / Lower Band Color, Width, Style** — visual styling for the confidence bands.
---
## Inputs — Info Box Group
The info box displays the engine's live diagnostic state so you always know what is actually running.
**Show Info Box** — toggles the info box on or off.
**Position** — where on the chart the info box appears.
**Text Size** — size of the info box text.
**Background / Border / Header colors** — visual styling.
---
## Reading the Info Box
**Candle Lookback** — confirms how many candles the fingerprint is built from.
**Forecast Horizon** — confirms how many bars forward the projection extends.
**Matches Used** — how many historical sequences qualified. If this is orange, no matches were found — the engine has nothing to project from. Try lowering the Similarity Floor, reducing the Candle Lookback, or increasing the Search Depth.
**Sim Floor / Fit** — two numbers. The left is the similarity threshold the engine actually settled on to reach your target match count. The right is the average similarity score of all the matches it found. Higher is better. A warning symbol next to the left number means the engine hit the Similarity Floor and could not find enough matches above it.
**Match Quality** — a composite score from Low to High that combines the average similarity of your matches, how close you got to your target match count, and whether the floor was hit. High means the engine found well-matched patterns. Low means the projection is built on weaker material and should be treated with more skepticism.
**Search Depth** — confirms the search depth setting currently active.
**Strictness** — confirms which Match Strictness level is active.
**Midline** — confirms whether you are running Median or Average.
**Bands** — confirms the active band mode and parameters. Shows either "Pctl 25/75" style or "StdDev ×1.0" style depending on your selection.
**Rewind** — shows Live when the indicator is running on the current bar, or ⏪ N bars back in orange when Historical Rewind is active.
---
## Practical Usage Tips
The forecast midline being relatively flat is not a failure — it often means the candle pattern genuinely did not predict a strong directional move historically. In that case the bands are the more useful signal, showing you the range of outcomes rather than pretending to know direction.
Tight bands with a flat midline means the pattern historically resolved with small moves in both directions — a low-conviction setup. Wide bands means the pattern was followed by large moves but in inconsistent directions. A midline with meaningful slope and tight bands is the highest-quality signal the engine can produce.
Treat Match Quality as your confidence filter. When it reads Low or Weak, reduce the weight you place on the projection. When it reads High, the engine found genuinely similar historical sequences and the projection has more structural basis behind it.
Use Historical Rewind to build intuition for the indicator before trusting it live. Step back 50 or 100 bars, observe how the projection compared to what actually happened, experiment with different Candle Lookback and Match Strictness settings, and develop a feel for when the indicator tends to be more or less reliable on your instrument and timeframe. The pattern line makes this especially useful — you can see exactly which candle sequence triggered the projection and compare it visually to where price went next.
---
## What This Indicator Does
The Candle Pattern Forecast engine looks at the most recent candles on your chart and asks a simple question: **has the market made this same sequence of candles before, and if so, what happened next?**
Every candle tells a story beyond just where price closed. It reveals how decisive the move was (the body), whether buyers or sellers got rejected at the extremes (the wicks), and which side was in control (direction). This indicator reads those four characteristics on each of the last N candles, builds a structural fingerprint of that sequence, then scans back through history looking for every other time the market made a similar sequence.
Once it finds enough matching sequences, it looks at what price actually did in the bars that followed each match. It then plots the median of all those outcomes as a forecast midline, and draws confidence bands showing the range where the bulk of those historical outcomes actually landed.
In plain terms: **the last time the market made candles that looked like this, here is what typically happened next.**
---
## What It Is Not
This is not a crystal ball. It is not predicting the future with certainty. It is showing you a probability-weighted summary of historical behavior following similar candle patterns. The quality of that summary depends entirely on how many good matches exist in history and how consistently those matches behaved afterward. The info box tells you both of those things in real time.
---
## The Display
**Pattern Line** — a purple line tracing the closes of the Candle Lookback window. This shows you exactly which candles the engine read to build its fingerprint, ending at the anchor point where the forecast begins. When Historical Rewind is active, the pattern line shifts back with the rest of the indicator so you always see the sequence that generated the projection.
**Forecast Midline** — the median (or average, if you switch modes) of all the forward price paths observed after matched candle sequences. This is your central tendency line — where the market most commonly ended up after patterns like this.
**Confidence Bands** — the range between the 25th and 75th percentile of historical outcomes by default. The middle 50% of your matched sequences ended up inside these bands. Tight bands mean the matches behaved consistently. Wide bands mean outcomes were scattered and the pattern had no reliable follow-through.
The bands naturally widen as they extend further forward in time. This is correct behavior — the further out you project, the more historical paths diverge from each other.
---
## Inputs — Model Group
**Non-Repaint Mode** — when on, the indicator anchors itself to the last fully closed candle and never changes its projection mid-bar. This is the honest setting for real trading decisions. When off, it updates live on the current bar, which means the projection shifts as price moves.
**Candle Lookback** — how many candles back the engine reads to build its fingerprint. At 5, it reads the last 5 candles and uses their combined anatomy as the pattern it is trying to match in history. Shorter lookbacks find more matches because the fingerprint is simpler. Longer lookbacks find fewer but potentially more specific matches. For short-term intraday work, 3–7 is a practical range. Going much above 10–15 starts to starve the engine of good matches.
**Search Depth** — how far back in history the engine scans looking for matches, measured in bars. At 2000, it looks back 2000 bars. More depth gives more candidates to match against, which is generally better. The limit is how much data your chart actually has.
**Forecast Horizon** — how many bars forward the projection extends after the anchor point. At 10, you get a 10-bar forecast. Keep this in a sensible relationship to your Candle Lookback — projecting 50 bars forward on a 5-candle pattern will produce a technically valid but practically meaningless result as the historical outcomes diverge too much to average meaningfully.
**Pattern Matches** — the target number of historical matches the engine tries to collect. It starts with a very strict similarity requirement and automatically loosens it until it has found this many matches, stopping at the Similarity Floor. More matches produce a smoother, more stable midline but dilute the directional signal. Fewer matches are noisier but more specific. 15–30 is a practical range.
**Similarity Floor** — the absolute minimum similarity score the engine will accept for a match, expressed as a percentage. If it cannot find enough matches above this floor, it takes whatever it found and shows a warning in the info box. This prevents the engine from building a projection on essentially unrelated historical patterns. Raising this makes the engine more selective. Lowering it makes it more permissive.
---
## Inputs — Historical Rewind Group
**Enable Rewind** — when toggled on, the entire indicator shifts backward in time by the number of bars you specify. The fingerprint is read from that past point, the scan searches only history that existed at that time, and the projection extends forward from there — into what is now known history. This lets you visually compare what the indicator would have projected against what price actually did. The pattern line also shifts back to show the candle sequence that was read at that point in time. When off, the indicator runs live as normal.
**Bars Back** — how many bars back to anchor the rewind. At 50, the engine reads the candle sequence from 50 bars ago, finds matches from history prior to that point, and draws the projection forward from there. You can then see how closely the actual subsequent price action followed the forecast. Set to 0 when rewind is enabled but you want to temporarily pause without toggling it off.
The info box Rewind row shows **Live** when rewind is off and **⏪ N bars back** in orange when active, so it is always clear whether you are looking at a live projection or a historical replay.
---
## Inputs — Match Strictness Group
**Match Strictness** — a single dropdown from 1 (Weak) to 5 (Exact) that controls how the engine weighs the four candle anatomy dimensions against each other when measuring similarity.
- **1 — Weak** — all four dimensions (body, upper wick, lower wick, direction) matter equally. The engine is looking for a general structural resemblance. Finds the most matches.
- **2 — Relaxed** — slight emphasis on body conviction. Still broadly permissive.
- **3 — Balanced** — the default. Body size is the dominant signal but wicks and direction still contribute meaningfully.
- **4 — Strict** — strong body emphasis. The engine is primarily matching on how decisive each candle was. Fewer but structurally closer matches.
- **5 — Exact** — body conviction is the overwhelming signal. Only candle sequences with very similar body profiles will qualify. Hardest to match, fewest results.
Think of this as tuning what kind of candle similarity matters most to you. If you care primarily about whether candles were indecisive or committed, lean toward Strict or Exact. If you want a broader match that respects the full candle structure equally, use Weak or Relaxed.
---
## Inputs — Pattern Line Group
**Show Pattern Line** — toggles the pattern line on or off. Default is on.
**Color** — color of the pattern line. Default is purple.
**Width** — thickness of the pattern line. Default is 2.
---
## Inputs — Forecast Group
**Midline Mode** — controls how the central forecast line is calculated from the matched outcomes.
- **Median** (default) — takes the middle value when all outcomes are sorted. More robust to outliers. If one matched sequence had a massive move that was atypical, it gets pushed to the edge rather than pulling the midline toward it.
- **Average** — takes the arithmetic mean of all outcomes. More sensitive to outliers and extreme moves in either direction.
For most use cases Median is the more honest representation of what typically happened.
**Midline Color / Width / Style** — visual styling for the forecast midline.
**Show Confidence Bands** — toggles the upper and lower bands on or off.
**Confidence Band Mode** — controls how the bands are calculated.
- **Percentile** (default) — sorts all historical outcomes at each forecast step and draws the bands at the exact percentile you specify. No assumptions about the shape of the distribution. The bands directly show you where real historical outcomes clustered.
- **Std Deviation** — draws the bands at mean ± N standard deviations. Assumes outcomes are roughly bell-shaped. Can be distorted by outliers inflating the standard deviation even when most matches behaved similarly.
**Lower Percentile / Upper Percentile** — only active in Percentile mode. Default is 25 and 75, meaning the bands show where the middle 50% of historical outcomes landed. Moving to 10/90 widens the bands to capture 80% of outcomes. Moving to 5/95 captures 90%. The right setting depends on whether you want to see the typical range or the full plausible range.
**Band Std Deviation** — only active in Std Deviation mode. At 1.0, the bands cover approximately 68% of outcomes. At 2.0, approximately 95%.
**Upper / Lower Band Color, Width, Style** — visual styling for the confidence bands.
---
## Inputs — Info Box Group
The info box displays the engine's live diagnostic state so you always know what is actually running.
**Show Info Box** — toggles the info box on or off.
**Position** — where on the chart the info box appears.
**Text Size** — size of the info box text.
**Background / Border / Header colors** — visual styling.
---
## Reading the Info Box
**Candle Lookback** — confirms how many candles the fingerprint is built from.
**Forecast Horizon** — confirms how many bars forward the projection extends.
**Matches Used** — how many historical sequences qualified. If this is orange, no matches were found — the engine has nothing to project from. Try lowering the Similarity Floor, reducing the Candle Lookback, or increasing the Search Depth.
**Sim Floor / Fit** — two numbers. The left is the similarity threshold the engine actually settled on to reach your target match count. The right is the average similarity score of all the matches it found. Higher is better. A warning symbol next to the left number means the engine hit the Similarity Floor and could not find enough matches above it.
**Match Quality** — a composite score from Low to High that combines the average similarity of your matches, how close you got to your target match count, and whether the floor was hit. High means the engine found well-matched patterns. Low means the projection is built on weaker material and should be treated with more skepticism.
**Search Depth** — confirms the search depth setting currently active.
**Strictness** — confirms which Match Strictness level is active.
**Midline** — confirms whether you are running Median or Average.
**Bands** — confirms the active band mode and parameters. Shows either "Pctl 25/75" style or "StdDev ×1.0" style depending on your selection.
**Rewind** — shows Live when the indicator is running on the current bar, or ⏪ N bars back in orange when Historical Rewind is active.
---
## Practical Usage Tips
The forecast midline being relatively flat is not a failure — it often means the candle pattern genuinely did not predict a strong directional move historically. In that case the bands are the more useful signal, showing you the range of outcomes rather than pretending to know direction.
Tight bands with a flat midline means the pattern historically resolved with small moves in both directions — a low-conviction setup. Wide bands means the pattern was followed by large moves but in inconsistent directions. A midline with meaningful slope and tight bands is the highest-quality signal the engine can produce.
Treat Match Quality as your confidence filter. When it reads Low or Weak, reduce the weight you place on the projection. When it reads High, the engine found genuinely similar historical sequences and the projection has more structural basis behind it.
Use Historical Rewind to build intuition for the indicator before trusting it live. Step back 50 or 100 bars, observe how the projection compared to what actually happened, experiment with different Candle Lookback and Match Strictness settings, and develop a feel for when the indicator tends to be more or less reliable on your instrument and timeframe. The pattern line makes this especially useful — you can see exactly which candle sequence triggered the projection and compare it visually to where price went next.
版本注释
# Candle Pattern Forecast — Change Log---
## 1. Bull Prob / Bear Prob
Bull Prob and Bear Prob are two new readings that appear at the bottom of the Info Box. Once the indicator finds all its historical matches, it looks at the very last bar of the forecast horizon for each one and asks a simple question: did price finish above or below the anchor close? The percentage of matches that finished higher becomes Bull Prob; the percentage that finished lower becomes Bear Prob. The two values always sum to 100%.
A strong skew in one direction — say 70% Bull / 30% Bear — means the majority of structurally similar past sequences resolved higher by the end of the projection window. A near-even split means history has been mixed and the projection should be read with more caution.
A few things to keep in mind:
- Both values show **n/a** when fewer than 10 matches are found. With a very small sample the numbers would be misleading, so the indicator withholds them.
- Bull Prob is lime green at 60%+, yellow between 50–59%, and gray below 50%.
- Bear Prob is red at 60%+, orange between 50–59%, and gray below 50%.
- There are no dedicated settings for these readings. They are driven automatically by the Pattern Matches and Forecast Horizon values already in the Model section.
---
## 2. Lock to Candle
Lock to Candle is a new settings group that pins the forecast anchor to a specific candle time that recurs each session — for example, the daily open, a futures settlement time, or any other fixed time of day you want to study consistently. When active, the entire indicator shifts to treat that candle as the present moment: the pattern lookback window, the match search, the projection lines, and the probability readings all anchor there instead of the live bar.
To use it, enable "Lock to Candle" and set the Hour and Minute in UTC (24-hour format) to match the candle you want. The indicator will find the most recent session candle at that time and anchor there automatically.
- **Days Back** lets you step back N sessions. Set it to 1 to anchor to yesterday's version of that candle, 2 for the session before that, and so on. Useful for reviewing past projections.
- **Auto Previous Session** (on by default) handles the case where today's target candle hasn't printed yet. With it on, the indicator automatically falls back to the prior session so you always see a valid projection. Turn it off if you only want the lock to activate once today's candle has actually appeared.
- When Lock to Candle is enabled it takes full priority over Historical Rewind. If a valid candle is found, Rewind is ignored entirely. If no valid candle is found and Auto Previous Session is off, the indicator falls back to Rewind if it's active, or to the live bar otherwise.
---
## 3. Historical Rewind
Historical Rewind lets you slide the entire indicator backward in time by a fixed number of bars. Every element — the lookback window, the match search, the projection lines, and the probability readings — shifts to treat the rewound bar as the present. Since that "future" is now visible on the chart, you can directly compare the historical projection against what actually happened.
To use it, enable "Enable Rewind" and set Bars Back to however far back you want to go. A value of 0 has no effect. The maximum is 2000 bars. Rewind only applies when Lock to Candle is off — if both are enabled, Lock takes priority.
When Rewind is active the Anchor row in the Info Box will show "⏪ N bars back" in orange so you always know at a glance that you're in review mode.
---
## 4. Info Box Updates
Two new rows have been added — Bull Prob and Bear Prob — and the previous Rewind row has been replaced by a smarter context-aware row simply called Anchor. This row always reflects whichever anchor mode is currently active, so you can see at a glance exactly where the indicator is anchored without having to check the settings.
The Anchor row has four possible states:
- **Lock active, candle found** — label reads "Anchor", value shows the exact date and time of the locked candle (e.g. 06/26/2026 13:30) in lime green.
- **Lock active, no candle found** — label reads "Anchor", value reads "No Anchor Lock" in orange.
- **Rewind active, Lock off** — label reads "Rewind", value shows "⏪ N bars back" in orange.
- **Both off** — label reads "Mode", value reads "Live" in gray.
The Info Box appearance settings remain the same: position, text size, background color, border color, header text color, and header background color are all still fully configurable in the Info Box settings group.
---
## New Settings Summary
**Lock to Candle group**
- Lock to Candle — enables session-time anchor locking. Off by default.
- Days Back — steps back N sessions from the most recent matching candle. Default 0.
- Hour (UTC) — the target candle hour in 24-hour UTC format. Default 13.
- Minute (UTC) — the target candle minute in UTC. Default 30.
- Auto Previous Session — falls back to the prior session if today's candle hasn't printed yet. On by default.
**Historical Rewind group**
- Enable Rewind — activates bar-offset rewind mode. Off by default.
- Bars Back — number of bars to shift the anchor into the past. Default 0, max 2000.
Bull Prob and Bear Prob have no dedicated settings — they are derived automatically from existing Pattern Matches and Forecast Horizon values.
开源脚本
秉承TradingView的精神,该脚本的作者将其开源,以便交易者可以查看和验证其功能。向作者致敬!您可以免费使用该脚本,但请记住,重新发布代码须遵守我们的网站规则。

免责声明
这些信息和出版物并非旨在提供,也不构成TradingView提供或认可的任何形式的财务、投资、交易或其他类型的建议或推荐。请阅读使用条款了解更多信息。
免责声明
这些信息和出版物并非旨在提供,也不构成TradingView提供或认可的任何形式的财务、投资、交易或其他类型的建议或推荐。请阅读使用条款了解更多信息。