OPEN-SOURCE SCRIPT
SPX | ES | SPY | NQ | QQQ Converter by TenAMTrader
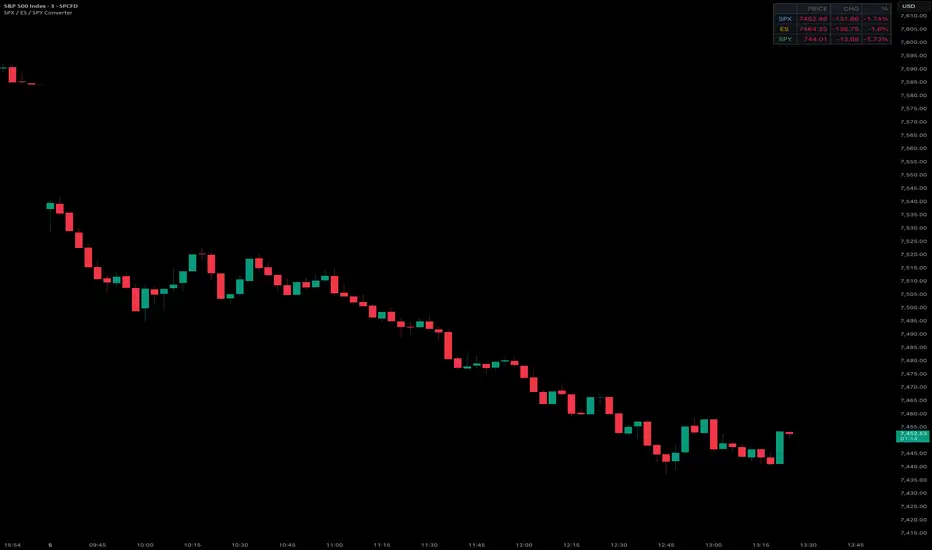
SPX | ES | SPY | NQ | QQQ Converter by TenAMTrader
A lightweight overlay table that displays real-time price, point change, and percentage change for your key S&P 500 and Nasdaq instruments — all in one glance, right on your chart.
Built to sit cleanly at the top of your SPX chart without cluttering your view. All instruments are pulled from the daily timeframe so change values always reflect the true day's move, regardless of what intraday timeframe your chart is set to.
Always displayed:
SPX (S&P 500 Index)
ES (E-mini S&P 500 Futures)
SPY (S&P 500 ETF)
Optional — toggle on/off in settings:
NQ (E-mini Nasdaq 100 Futures)
QQQ (Nasdaq 100 ETF)
Each row shows:
Live price
Point change vs. prior day's close
Percentage change vs. prior day's close
Color coded green/red on all values for instant readability. Designed for traders who need quick cross-instrument reference without switching charts or windows.
Settings:
Position — Top Right / Top Left / Top Center
Text Size — Tiny / Small / Normal / Large
Instruments — Toggle NQ and QQQ on or off (default off)
This script is for informational purposes only and does not constitute financial advice. All data is provided as-is with no guarantee of accuracy or timeliness. Past performance is not indicative of future results. Trading involves substantial risk of loss and is not suitable for all investors. The author assumes no liability for any trading decisions made based on this tool. Always do your own research and consult a qualified financial advisor before making any investment decisions.
A lightweight overlay table that displays real-time price, point change, and percentage change for your key S&P 500 and Nasdaq instruments — all in one glance, right on your chart.
Built to sit cleanly at the top of your SPX chart without cluttering your view. All instruments are pulled from the daily timeframe so change values always reflect the true day's move, regardless of what intraday timeframe your chart is set to.
Always displayed:
SPX (S&P 500 Index)
ES (E-mini S&P 500 Futures)
SPY (S&P 500 ETF)
Optional — toggle on/off in settings:
NQ (E-mini Nasdaq 100 Futures)
QQQ (Nasdaq 100 ETF)
Each row shows:
Live price
Point change vs. prior day's close
Percentage change vs. prior day's close
Color coded green/red on all values for instant readability. Designed for traders who need quick cross-instrument reference without switching charts or windows.
Settings:
Position — Top Right / Top Left / Top Center
Text Size — Tiny / Small / Normal / Large
Instruments — Toggle NQ and QQQ on or off (default off)
This script is for informational purposes only and does not constitute financial advice. All data is provided as-is with no guarantee of accuracy or timeliness. Past performance is not indicative of future results. Trading involves substantial risk of loss and is not suitable for all investors. The author assumes no liability for any trading decisions made based on this tool. Always do your own research and consult a qualified financial advisor before making any investment decisions.
开源脚本
秉承TradingView的精神,该脚本的作者将其开源,以便交易者可以查看和验证其功能。向作者致敬!您可以免费使用该脚本,但请记住,重新发布代码须遵守我们的网站规则。

免责声明
这些信息和出版物并非旨在提供,也不构成TradingView提供或认可的任何形式的财务、投资、交易或其他类型的建议或推荐。请阅读使用条款了解更多信息。
开源脚本
秉承TradingView的精神,该脚本的作者将其开源,以便交易者可以查看和验证其功能。向作者致敬!您可以免费使用该脚本,但请记住,重新发布代码须遵守我们的网站规则。
免责声明
这些信息和出版物并非旨在提供,也不构成TradingView提供或认可的任何形式的财务、投资、交易或其他类型的建议或推荐。请阅读使用条款了解更多信息。