OPEN-SOURCE SCRIPT
Apex Market Breadth Oscillator [Pineify]
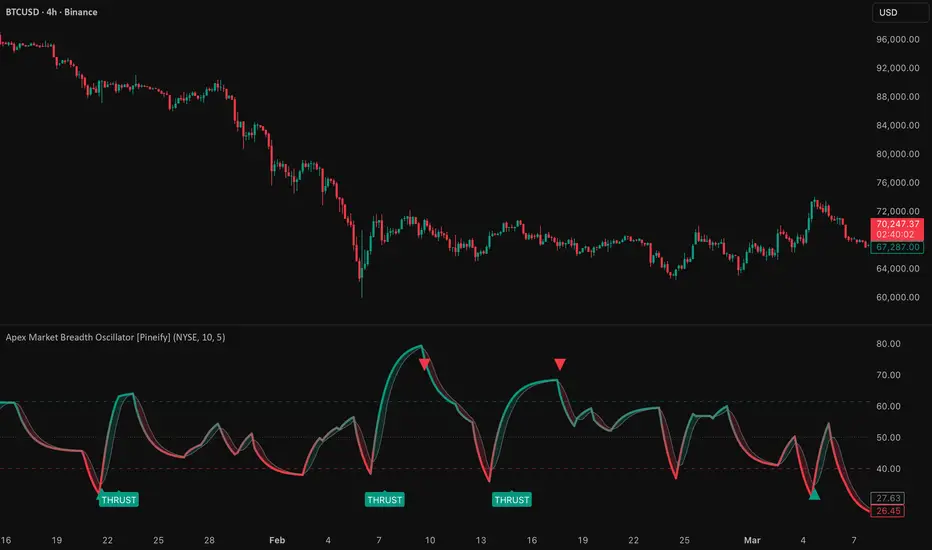
Apex Market Breadth Oscillator [Pineify]
The Apex Market Breadth Oscillator is a composite market-internal momentum tool that blends Advance/Decline Issue Breadth with Up/Down Volume Breadth into a single, smoothed oscillator — giving traders a unified view of how broadly the market is participating in a move. Rather than relying on price action of a single index, this indicator looks beneath the surface by measuring both the percentage of stocks advancing and the percentage of volume flowing into advancing stocks, then combining them into one reading. The oscillator is built on the Whaley Breadth Thrust methodology and incorporates Martin Zweig's classic breadth thrust threshold (61.5) as a key reference level. An EMA-smoothed composite line is paired with an SMA signal line for crossover-based timing, while gradient coloring and zone-based buy/sell signals help traders quickly identify oversold recoveries, overbought exhaustion, and rare breadth thrust events that have historically preceded major bull market advances.
Key Features
How It Works
The indicator follows a four-stage calculation pipeline to transform raw market breadth data into actionable signals:
Trading Ideas and Insights
How Multiple Indicators Work Together
The Apex Market Breadth Oscillator integrates several analytical components into a cohesive system, each serving a distinct purpose:
The synergy is sequential: raw breadth data (issues + volume) → normalized ratios (ADT + UDT) → blended composite → EMA smoothing → SMA signal line → zone-filtered crossover signals. Each layer refines the raw data further, producing signals that require both broad market participation AND volume confirmation AND momentum shift AND extreme positioning to trigger — a multi-filter approach that dramatically reduces false signals compared to using any single breadth measure alone.
Unique Aspects
How to Use
Customization
Conclusion
The Apex Market Breadth Oscillator provides a comprehensive, under-the-hood view of market health by combining issue breadth and volume breadth into a single composite oscillator. Rooted in the Whaley Breadth Thrust methodology and incorporating Martin Zweig's historically significant thrust threshold, the indicator goes beyond surface-level price analysis to reveal whether rallies and declines are supported by broad participation and institutional volume. Its zone-filtered buy/sell signals, gradient color mapping, and rare breadth thrust labels give traders a structured, evidence-based framework for identifying high-probability turning points and confirming the strength of market moves. Whether used as a standalone market timing tool or as a confirmation layer alongside price-based indicators, the Apex Market Breadth Oscillator delivers actionable insights into the true breadth and conviction behind market movements.
The Apex Market Breadth Oscillator is a composite market-internal momentum tool that blends Advance/Decline Issue Breadth with Up/Down Volume Breadth into a single, smoothed oscillator — giving traders a unified view of how broadly the market is participating in a move. Rather than relying on price action of a single index, this indicator looks beneath the surface by measuring both the percentage of stocks advancing and the percentage of volume flowing into advancing stocks, then combining them into one reading. The oscillator is built on the Whaley Breadth Thrust methodology and incorporates Martin Zweig's classic breadth thrust threshold (61.5) as a key reference level. An EMA-smoothed composite line is paired with an SMA signal line for crossover-based timing, while gradient coloring and zone-based buy/sell signals help traders quickly identify oversold recoveries, overbought exhaustion, and rare breadth thrust events that have historically preceded major bull market advances.
Key Features
- Composite breadth oscillator — merges Advance/Decline Issue Breadth (ADT) and Up/Down Volume Breadth (UDT) into a single reading that captures both stock participation and capital flow direction.
- Whaley Breadth Thrust methodology — calculates the percentage of advancing issues and advancing volume relative to their totals, providing a normalized 0–100 scale for cross-market comparison.
- EMA-smoothed oscillator with SMA signal line — the composite is smoothed via EMA for noise reduction while retaining responsiveness; an SMA signal line provides crossover-based momentum shift detection.
- Martin Zweig's breadth thrust threshold — the 61.5 level marks the historically significant thrust zone where breadth surges have preceded powerful multi-month rallies.
- Zone-based buy/sell signals — buy signals fire only in oversold territory (below 40), sell signals fire only in overbought territory (above 61.5), filtering out low-conviction crossovers in the neutral zone.
- Dynamic gradient coloring — the oscillator line transitions smoothly from red (oversold) to green (overbought) based on its position between the 40 and 61.5 levels, providing an instant visual read on market health.
- Breadth thrust event labels — rare "THRUST" labels mark the moment the oscillator crosses above 61.5, highlighting high-conviction bullish impulse events.
- Multi-exchange support — toggle between NYSE and NASDAQ breadth data to analyze large-cap or growth/tech-weighted market internals.
How It Works
The indicator follows a four-stage calculation pipeline to transform raw market breadth data into actionable signals:
- Data sourcing: Four breadth series are pulled from the selected exchange (NYSE or NASDAQ) — advancing issues, declining issues, advancing volume, and declining volume. These are standard USI (US Indices) breadth tickers that represent the internal composition of the market on each bar.
- Breadth ratio calculation: Two normalized ratios are computed. The Advance/Decline Thrust (ADT) measures the percentage of advancing issues relative to total issues: ADT = 100 × advancing / (advancing + declining). The Up/Down Volume Thrust (UDT) applies the same formula to volume: UDT = 100 × up volume / (up volume + down volume). Both ratios range from 0 to 100, where 50 represents equilibrium.
- Composite smoothing: ADT and UDT are averaged to create a raw composite that reflects both issue participation and volume participation. This raw composite is then smoothed with an Exponential Moving Average (EMA) of configurable length (default: 10). The EMA removes bar-to-bar noise while preserving the oscillator's ability to react quickly to genuine breadth shifts.
- Signal line generation: A Simple Moving Average (SMA) of the smoothed composite (default length: 5) serves as the signal line. Crossovers between the faster EMA-smoothed composite and the slower SMA signal line identify momentum inflection points, which are then filtered by zone (oversold or overbought) to produce the final buy and sell signals.
Trading Ideas and Insights
- Oversold recovery entries: When the oscillator drops below 40, the market is experiencing broad-based selling — most stocks are declining and declining volume dominates. A buy signal (composite crossing above the signal line while below 40) captures the early momentum shift as breadth begins recovering. These signals identify potential bottoms where risk/reward is most favorable.
- Overbought exhaustion exits: When the oscillator rises above 61.5, the market is experiencing an exceptionally broad advance. A sell signal (composite crossing below the signal line while above 61.5) identifies the moment breadth momentum starts fading after an extreme surge. This can be used to take profits or tighten stops on long positions.
- Breadth thrust confirmation: The "THRUST" label marks the rare event where the oscillator surges past 61.5. Historically, Zweig Breadth Thrusts — where breadth rapidly transitions from oversold to above the thrust threshold — have preceded significant market gains over the following 6–12 months. These events can be used as high-conviction confirmation for establishing or adding to long-term positions.
- Divergence analysis: When a major index makes new highs but the Apex Breadth Oscillator fails to confirm (lower highs on the oscillator), it signals narrowing participation — fewer stocks are driving the rally. This breadth divergence is a classic warning sign of potential market weakness ahead.
- Equilibrium as a trend filter: Sustained readings above 50 indicate healthy broad market participation; sustained readings below 50 suggest internal weakness even if headline indices appear stable. Use the 50 level as a simple filter — favor long setups when the oscillator is above 50, and exercise caution or favor short setups when below.
How Multiple Indicators Work Together
The Apex Market Breadth Oscillator integrates several analytical components into a cohesive system, each serving a distinct purpose:
- Advance/Decline Issue Breadth (ADT) — participation measurement: ADT answers the question "what percentage of stocks are advancing?" This captures the breadth of participation regardless of the size of individual stock moves. A market where 80% of stocks are rising is fundamentally healthier than one where only 20% are rising — even if both scenarios produce the same index return.
- Up/Down Volume Breadth (UDT) — capital flow measurement: UDT answers the question "what percentage of volume is flowing into advancing stocks?" This adds a volume-weighted dimension that ADT alone cannot provide. High UDT values indicate that institutional-scale capital is flowing into advancing stocks, not just a large number of small-cap stocks ticking higher on minimal volume.
- EMA composite smoothing — noise reduction: Averaging ADT and UDT and applying EMA smoothing transforms two noisy daily breadth readings into a single, clean oscillator. The EMA's exponential weighting ensures recent breadth conditions have more influence than older ones, keeping the oscillator responsive to current market dynamics.
- SMA signal line — timing mechanism: The SMA signal line adds a crossover-based timing layer. While the composite oscillator tells you the current state of market breadth, the signal line crossovers tell you when that state is changing — identifying the inflection points where breadth momentum is shifting from deteriorating to improving (or vice versa).
The synergy is sequential: raw breadth data (issues + volume) → normalized ratios (ADT + UDT) → blended composite → EMA smoothing → SMA signal line → zone-filtered crossover signals. Each layer refines the raw data further, producing signals that require both broad market participation AND volume confirmation AND momentum shift AND extreme positioning to trigger — a multi-filter approach that dramatically reduces false signals compared to using any single breadth measure alone.
Unique Aspects
- Dual-breadth composite: Most breadth oscillators use either issue breadth or volume breadth in isolation. The Apex Market Breadth Oscillator combines both into a single composite, ensuring that signals reflect genuine broad-based market moves backed by volume — not just a large number of stocks ticking marginally higher on thin volume.
- Zweig-inspired threshold levels: The 61.5 thrust level is not an arbitrary overbought line — it is derived from Martin Zweig's Breadth Thrust indicator, one of the most historically reliable bullish signals in market analysis. The 40 oversold level provides the corresponding floor, creating a framework rooted in decades of market research.
- Zone-filtered signals: Rather than generating signals on every crossover (which would produce many false signals in the neutral 40–61.5 zone), the indicator restricts buy signals to oversold territory and sell signals to overbought territory. This zone-based filtering ensures signals only fire at extreme readings where the probability of a meaningful reversal is highest.
- Gradient color mapping: The oscillator line uses a continuous gradient from red to green mapped to the 40–61.5 range, rather than a simple binary color switch. This provides an intuitive, at-a-glance reading of where the oscillator sits within the oversold-to-overbought spectrum without needing to check exact values.
How to Use
- Add the indicator to your chart. It appears in a separate pane below the price chart, displaying the composite breadth oscillator, signal line, and three reference levels (40, 50, 61.5).
- Select your preferred exchange — NYSE for large-cap/value-oriented breadth analysis, or NASDAQ for tech/growth-weighted breadth analysis. The choice depends on which market segment you are trading or want to monitor for confirmation.
- Monitor the oscillator's color: red tones indicate the oscillator is near or below the oversold zone (40), suggesting broad market weakness. Green tones indicate the oscillator is near or above the overbought/thrust zone (61.5), suggesting strong broad participation.
- Watch for BUY signals (green triangles at the bottom) — these appear when the oscillator crosses above its signal line while in oversold territory (below 40). Consider entering long positions or adding to existing ones.
- Watch for SELL signals (red triangles at the top) — these appear when the oscillator crosses below its signal line while in overbought territory (above 61.5). Consider taking profits or tightening stops on long positions.
- Pay special attention to THRUST labels (green labels at the bottom) — these mark the rare event where the oscillator surges above 61.5. Historically, these breadth thrust events have preceded significant multi-month market advances and represent high-conviction bullish confirmation.
- Use the 50 equilibrium level as a simple trend filter — sustained readings above 50 indicate healthy market internals; sustained readings below 50 suggest underlying weakness.
- Compare the oscillator's trajectory with the price index for divergence analysis — if the index makes new highs but the oscillator does not, breadth is narrowing and caution is warranted.
Customization
- Market Exchange (default: NYSE): Selects which exchange's breadth data to use. NYSE breadth reflects large-cap, broad market participation. NASDAQ breadth is more sensitive to technology and growth stock activity. Choose based on your trading focus or use both in separate indicator instances for a complete picture.
- Oscillator Smoothing (default: 10): Controls the EMA period applied to the raw composite. Lower values (e.g., 5–7) produce a more volatile, responsive oscillator that generates more signals — suitable for short-term trading. Higher values (e.g., 15–21) produce a smoother oscillator with fewer but more reliable signals — suitable for swing or position trading.
- Signal Line Length (default: 5): Controls the SMA period of the signal line. Shorter values make the signal line track the oscillator more closely, triggering crossovers sooner but with more potential for whipsaws. Longer values add lag but filter out minor fluctuations, producing more deliberate crossover signals.
Conclusion
The Apex Market Breadth Oscillator provides a comprehensive, under-the-hood view of market health by combining issue breadth and volume breadth into a single composite oscillator. Rooted in the Whaley Breadth Thrust methodology and incorporating Martin Zweig's historically significant thrust threshold, the indicator goes beyond surface-level price analysis to reveal whether rallies and declines are supported by broad participation and institutional volume. Its zone-filtered buy/sell signals, gradient color mapping, and rare breadth thrust labels give traders a structured, evidence-based framework for identifying high-probability turning points and confirming the strength of market moves. Whether used as a standalone market timing tool or as a confirmation layer alongside price-based indicators, the Apex Market Breadth Oscillator delivers actionable insights into the true breadth and conviction behind market movements.
开源脚本
秉承TradingView的精神,该脚本的作者将其开源,以便交易者可以查看和验证其功能。向作者致敬!您可以免费使用该脚本,但请记住,重新发布代码须遵守我们的网站规则。

🚀🚀🚀 Pineify - pineify.app
Essential Toolkit for Every Trader
- AI Pine Script Generator
- Finance AI Agent
- AI Stock Picker
- Pine Script Visual Editor
- Invited indicators
- Strategy Optimizer
- Trading Journal
- Backtest Report
Essential Toolkit for Every Trader
- AI Pine Script Generator
- Finance AI Agent
- AI Stock Picker
- Pine Script Visual Editor
- Invited indicators
- Strategy Optimizer
- Trading Journal
- Backtest Report
免责声明
这些信息和出版物并非旨在提供,也不构成TradingView提供或认可的任何形式的财务、投资、交易或其他类型的建议或推荐。请阅读使用条款了解更多信息。
开源脚本
秉承TradingView的精神,该脚本的作者将其开源,以便交易者可以查看和验证其功能。向作者致敬!您可以免费使用该脚本,但请记住,重新发布代码须遵守我们的网站规则。
🚀🚀🚀 Pineify - pineify.app
Essential Toolkit for Every Trader
- AI Pine Script Generator
- Finance AI Agent
- AI Stock Picker
- Pine Script Visual Editor
- Invited indicators
- Strategy Optimizer
- Trading Journal
- Backtest Report
Essential Toolkit for Every Trader
- AI Pine Script Generator
- Finance AI Agent
- AI Stock Picker
- Pine Script Visual Editor
- Invited indicators
- Strategy Optimizer
- Trading Journal
- Backtest Report
免责声明
这些信息和出版物并非旨在提供,也不构成TradingView提供或认可的任何形式的财务、投资、交易或其他类型的建议或推荐。请阅读使用条款了解更多信息。