OPEN-SOURCE SCRIPT
Masayan Volume Zone Profile Indicator
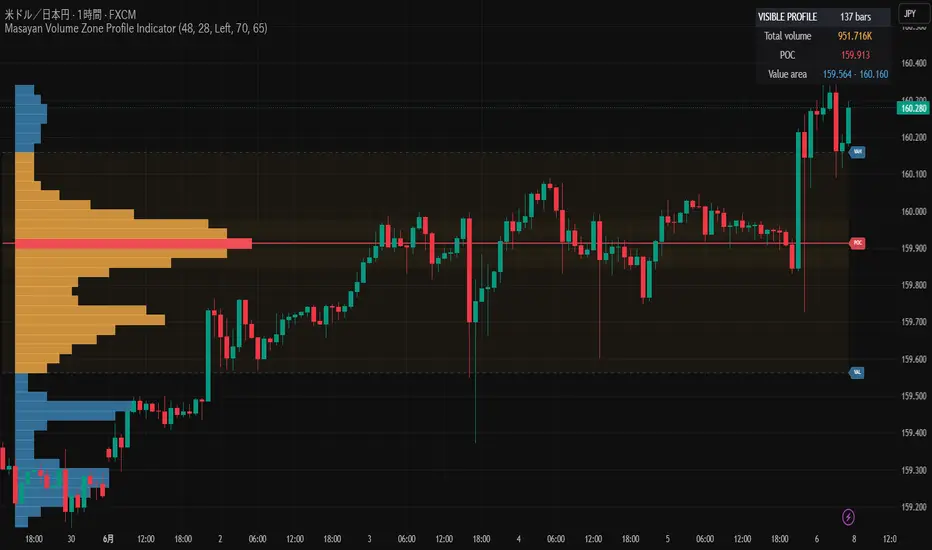
Masayan Volume Zone Profile Indicator is a dynamic volume-zone analysis tool that automatically calculates an estimated volume profile from all bars currently visible on the chart.
The indicator detects the chart’s visible range and recalculates whenever the user scrolls or zooms. No fixed lookback period is required.
Each visible candle’s TradingView volume is distributed across the price rows overlapped by its high-low range. The resulting profile highlights the price zones where the greatest estimated volume was concentrated.
Main features:
Automatic visible-chart range detection
Dynamic recalculation when scrolling or zooming
Estimated price-by-volume profile
Visible-range total volume summary
Estimated Point of Control
Value Area High and Value Area Low
Highlighted high-volume zones
Left or right profile positioning
POC-cross and value-area-entry alerts
Optional display controls
The profile is always drawn inside the currently visible chart range. Value-area volume bars are displayed in orange, volume outside the value area is displayed in blue, and the Point of Control is highlighted in red.
This indicator does not use broker order-book data, actual bid/ask volume, or market participant positions. The displayed profile is estimated from TradingView volume data and candle price ranges.
For forex symbols, TradingView volume may represent tick volume rather than centralized traded volume.
This script is intended for chart analysis, research, and educational purposes only.
It does not guarantee future performance and should not be considered financial advice.
Please test carefully before using it in any trading decision.
The indicator detects the chart’s visible range and recalculates whenever the user scrolls or zooms. No fixed lookback period is required.
Each visible candle’s TradingView volume is distributed across the price rows overlapped by its high-low range. The resulting profile highlights the price zones where the greatest estimated volume was concentrated.
Main features:
Automatic visible-chart range detection
Dynamic recalculation when scrolling or zooming
Estimated price-by-volume profile
Visible-range total volume summary
Estimated Point of Control
Value Area High and Value Area Low
Highlighted high-volume zones
Left or right profile positioning
POC-cross and value-area-entry alerts
Optional display controls
The profile is always drawn inside the currently visible chart range. Value-area volume bars are displayed in orange, volume outside the value area is displayed in blue, and the Point of Control is highlighted in red.
This indicator does not use broker order-book data, actual bid/ask volume, or market participant positions. The displayed profile is estimated from TradingView volume data and candle price ranges.
For forex symbols, TradingView volume may represent tick volume rather than centralized traded volume.
This script is intended for chart analysis, research, and educational purposes only.
It does not guarantee future performance and should not be considered financial advice.
Please test carefully before using it in any trading decision.
开源脚本
秉承TradingView的精神,该脚本的作者将其开源,以便交易者可以查看和验证其功能。向作者致敬!您可以免费使用该脚本,但请记住,重新发布代码须遵守我们的网站规则。

免责声明
这些信息和出版物并非旨在提供,也不构成TradingView提供或认可的任何形式的财务、投资、交易或其他类型的建议或推荐。请阅读使用条款了解更多信息。
免责声明
这些信息和出版物并非旨在提供,也不构成TradingView提供或认可的任何形式的财务、投资、交易或其他类型的建议或推荐。请阅读使用条款了解更多信息。