已更新
MOYA Quarterly Theory & Higher Timeframe [RealSebastianMoya]
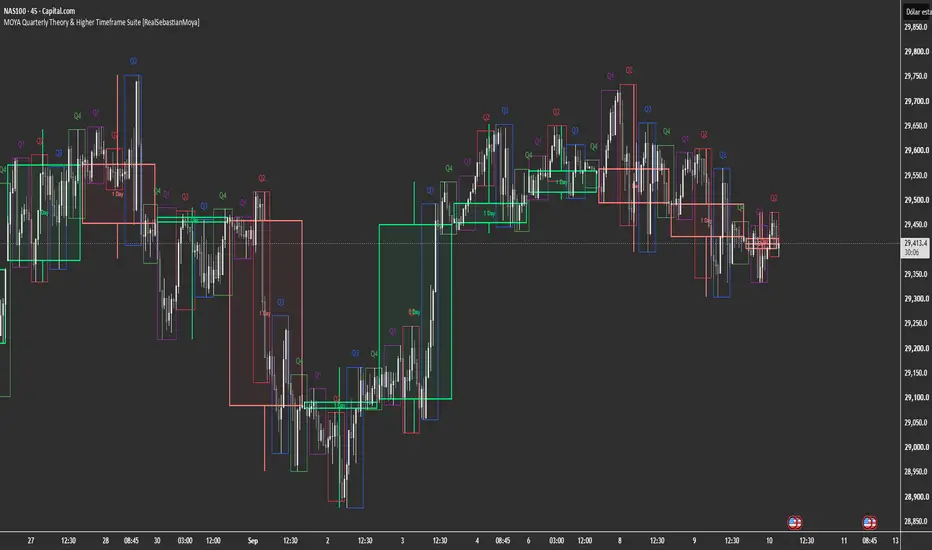
Hello traders!
Introducing: "MOYA Quarterly Theory & Higher Timeframe Suite"
Two tools in one indicator: a higher timeframe candle overlay projected directly onto your current chart, and a complete map of Quarterly Theory sessions (Q23/Q90/Q360) — the fractal time framework behind how many ICT/Smart Money traders read the trading day.
♦ Module 1 — Higher Timeframe Candle Overlay
What it does: Draws the candles of a higher timeframe (any of 35 options, from 1 minute to 7 months) directly on your current chart, without switching timeframes or opening another window. Each higher timeframe candle appears as its own box with a wick, updating live as it forms, and carries a text label showing exactly which timeframe it represents (e.g. "5D", "4H", "1W").
Why it matters: When trading on a lower timeframe (1m, 5m, 15m), losing sight of higher timeframe context is the most common mistake. Instead of constantly switching charts to check "what is the 4H candle doing right now?", you see it forming live, right next to your current price action, without breaking focus on your entry.

Settings:
• candlestick overlay — pick the timeframe to project (any of 35 options, from 1 minute to 7 months)
• Bullish/Bearish Fill Color and Line Color — independent colors for bullish and bearish candles
• Candle Body Transparency — how transparent the candle body is
• Line Thickness — border and wick width
• Show Timeframe Label — toggles the text label shown on each candle (e.g. "5D")
• Timeframe Label Color / Opacity / Size — color, opacity, and size of that label, fully independent from the rest of the styling
♦ Module 2 — Quarterly Theory (Q23 / Q90 / Q360)
The Theory
Quarterly Theory is a fractal analysis framework: the same 4-phase pattern repeats at different nested time scales within the trading day. The four phases are:
• Q1 — Accumulation: the initial range where a position is built, slow and contained movement.
• Q2 — Manipulation: a move that breaks outside the Q1 range (often a liquidity raid), designed to trap positions in the wrong direction.
• Q3 — Distribution: the real directional move — where price actually goes after the manipulation.
• Q4 — Continuation/Reversal: either continues the Q3 direction, or reverses — depending on higher timeframe context.
The Fractal Nesting — Q360 → Q90 → Q23
This indicator draws three levels of this same pattern, one nested inside the other:
Level 1 — Q360 (6-Hour Sessions): The full trading day divides into 4 six-hour sessions, each acting as one phase of the daily cycle:
• Asia (18:00-00:00 UTC) = Q1
• London (00:00-06:00 UTC) = Q2
• New York (06:00-12:00 UTC) = Q3
• CBDR / PM (12:00-18:00 UTC) = Q4

Level 2 — Q90 (90-Minute Sessions): Each of those 4 six-hour sessions subdivides into 4 quarters of 90 minutes — repeating the same Accumulation → Manipulation → Distribution → Continuation pattern, now at intraday scale within that specific session.

Level 3 — Q23 (~23-Minute Sessions): Each 90-minute quarter subdivides again into 4 micro-quarters of roughly 23 minutes — the same pattern, repeated a third time, at the finest scale.

The core idea: if you know which "quarter" of the larger cycle you're in, you know what behavior to expect from price at that moment — it isn't random, it's the same structure repeating fractally.
Settings
• UTC Offset — adjusts all session times to your own timezone
• Use Exchange Timezone — uses the symbol's exchange timezone
• instead of a manual offset
Show Q23 / Q90 / Q360 — toggles each fractal level independently
• Box Transparency / Border / Labels / Line Width — fully independent styling per level (Q23, Q90, Q360)
• Individual Sessions (Asia / London / New York / CBDR) — every quarter of every level has its own time window, label text, color, and show/hide toggle — so you can, for example, turn off just London's Q2 without touching anything else
Technical note: Q90 only displays on timeframes of 15 minutes or lower, and Q360 only between 15 and 60 minutes — this is intentional, since these quarters lose visual meaning on timeframes where a single candle already spans several hours.
♦ How To Use It — Practical Example
1. Identify which 6-hour session (Q360) you're in — for example, New York.
2. Within that session, identify which 90-minute quarter (Q90) you're in.
3. If you're in Q2 (Manipulation) of that 90-minute window, expect a move that breaks the prior range — don't take it as a genuine breakout yet.
4. Once you're in Q3 (Distribution), that's where the genuine directional move is expected — the highest-probability window to take an entry in the day's real direction.
5. Run Module 1 (HTF Overlay) in parallel — if the higher timeframe candle you're projecting confirms the same direction as your Q3, you have confluence between the fractal context and the higher timeframe context.
Introducing: "MOYA Quarterly Theory & Higher Timeframe Suite"
Two tools in one indicator: a higher timeframe candle overlay projected directly onto your current chart, and a complete map of Quarterly Theory sessions (Q23/Q90/Q360) — the fractal time framework behind how many ICT/Smart Money traders read the trading day.
♦ Module 1 — Higher Timeframe Candle Overlay
What it does: Draws the candles of a higher timeframe (any of 35 options, from 1 minute to 7 months) directly on your current chart, without switching timeframes or opening another window. Each higher timeframe candle appears as its own box with a wick, updating live as it forms, and carries a text label showing exactly which timeframe it represents (e.g. "5D", "4H", "1W").
Why it matters: When trading on a lower timeframe (1m, 5m, 15m), losing sight of higher timeframe context is the most common mistake. Instead of constantly switching charts to check "what is the 4H candle doing right now?", you see it forming live, right next to your current price action, without breaking focus on your entry.
Settings:
• candlestick overlay — pick the timeframe to project (any of 35 options, from 1 minute to 7 months)
• Bullish/Bearish Fill Color and Line Color — independent colors for bullish and bearish candles
• Candle Body Transparency — how transparent the candle body is
• Line Thickness — border and wick width
• Show Timeframe Label — toggles the text label shown on each candle (e.g. "5D")
• Timeframe Label Color / Opacity / Size — color, opacity, and size of that label, fully independent from the rest of the styling
♦ Module 2 — Quarterly Theory (Q23 / Q90 / Q360)
The Theory
Quarterly Theory is a fractal analysis framework: the same 4-phase pattern repeats at different nested time scales within the trading day. The four phases are:
• Q1 — Accumulation: the initial range where a position is built, slow and contained movement.
• Q2 — Manipulation: a move that breaks outside the Q1 range (often a liquidity raid), designed to trap positions in the wrong direction.
• Q3 — Distribution: the real directional move — where price actually goes after the manipulation.
• Q4 — Continuation/Reversal: either continues the Q3 direction, or reverses — depending on higher timeframe context.
The Fractal Nesting — Q360 → Q90 → Q23
This indicator draws three levels of this same pattern, one nested inside the other:
Level 1 — Q360 (6-Hour Sessions): The full trading day divides into 4 six-hour sessions, each acting as one phase of the daily cycle:
• Asia (18:00-00:00 UTC) = Q1
• London (00:00-06:00 UTC) = Q2
• New York (06:00-12:00 UTC) = Q3
• CBDR / PM (12:00-18:00 UTC) = Q4
Level 2 — Q90 (90-Minute Sessions): Each of those 4 six-hour sessions subdivides into 4 quarters of 90 minutes — repeating the same Accumulation → Manipulation → Distribution → Continuation pattern, now at intraday scale within that specific session.
Level 3 — Q23 (~23-Minute Sessions): Each 90-minute quarter subdivides again into 4 micro-quarters of roughly 23 minutes — the same pattern, repeated a third time, at the finest scale.
The core idea: if you know which "quarter" of the larger cycle you're in, you know what behavior to expect from price at that moment — it isn't random, it's the same structure repeating fractally.
Settings
• UTC Offset — adjusts all session times to your own timezone
• Use Exchange Timezone — uses the symbol's exchange timezone
• instead of a manual offset
Show Q23 / Q90 / Q360 — toggles each fractal level independently
• Box Transparency / Border / Labels / Line Width — fully independent styling per level (Q23, Q90, Q360)
• Individual Sessions (Asia / London / New York / CBDR) — every quarter of every level has its own time window, label text, color, and show/hide toggle — so you can, for example, turn off just London's Q2 without touching anything else
Technical note: Q90 only displays on timeframes of 15 minutes or lower, and Q360 only between 15 and 60 minutes — this is intentional, since these quarters lose visual meaning on timeframes where a single candle already spans several hours.
♦ How To Use It — Practical Example
1. Identify which 6-hour session (Q360) you're in — for example, New York.
2. Within that session, identify which 90-minute quarter (Q90) you're in.
3. If you're in Q2 (Manipulation) of that 90-minute window, expect a move that breaks the prior range — don't take it as a genuine breakout yet.
4. Once you're in Q3 (Distribution), that's where the genuine directional move is expected — the highest-probability window to take an entry in the day's real direction.
5. Run Module 1 (HTF Overlay) in parallel — if the higher timeframe candle you're projecting confirms the same direction as your Q3, you have confluence between the fractal context and the higher timeframe context.
版本注释
---
NEW: Macro Cycles (Monthly & Weekly Quarters)
---
Extends the same fractal Quarterly Theory logic beyond the intraday sessions to the macro scale — the monthly and weekly cycle now split into their own AMDX-style quarters.
---
HOW IT WORKS
---
• Monthly Quarters (Q1-Q4): splits the calendar month into 4 quarters by day range — Q1 (days 1-7), Q2 (days 8-14), Q3 (days 15-21), Q4 (day 22 to end of month)
• Weekly Quarters (Q1-Q5): splits the trading week into 5 quarters, one per weekday — Monday through Friday
• Independent show/hide, label text, and color per quarter, at both the Monthly and Weekly level
• Shared box transparency, border, label visibility, and line width controls per cycle type
• New master toggle "Enable Macro Cycles" turns the entire module on or off at once
---
NEW: True Opens
---
Plots the exact opening price of four key cycles as horizontal reference lines — a classic ICT/Smart Money concept used to gauge whether price is trading above or below the "true" open of the day, week, month, or quarter, which often differs from the exchange's midnight open.
---
HOW IT WORKS
---
• True Day Open — the open price at 00:00
• True Week Open — the open price at Monday 00:00
• True Month Open — the open price on the 1st of the month at 00:00
• True Quarter Open — the open price at the start of each calendar quarter
• Each line has its own independent color; shared controls for line style (Solid/Dotted/Dashed), width, and optional labels
• New master toggle "Enable True Opens" turns the entire module on or off at once
• Only renders on intraday timeframes, where these reference points are meaningful
---
IMPROVED: Higher Timeframe Candle Overlay
---
Each HTF candle can now display a text label showing exactly which timeframe it represents (e.g. "1D", "4H", "1W") directly on the candle, with its own adjustable label size — no more guessing which projected timeframe you're looking at.
---
Everything above is optional and additive — your existing session, HTF overlay, and Quarterly Theory settings are unaffected unless you turn these new modules on.

免责声明
这些信息和出版物并非旨在提供,也不构成TradingView提供或认可的任何形式的财务、投资、交易或其他类型的建议或推荐。请阅读使用条款了解更多信息。
免责声明
这些信息和出版物并非旨在提供,也不构成TradingView提供或认可的任何形式的财务、投资、交易或其他类型的建议或推荐。请阅读使用条款了解更多信息。