OPEN-SOURCE SCRIPT
PSP zones with validation
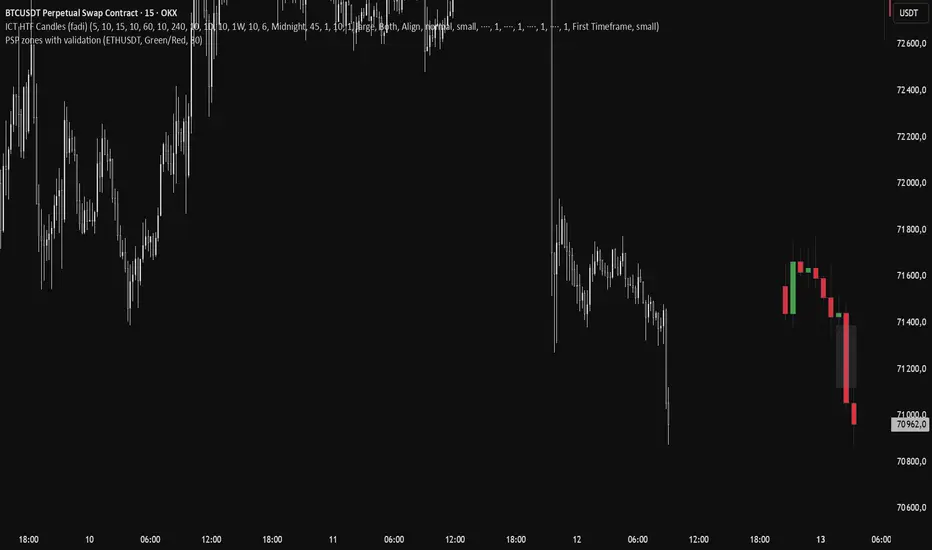
This indicator implements a structured cross-asset correlation signal model (PSP — Price Structure Parity) combined with dynamic zone-based market representation and invalidation logic.
Unlike traditional correlation tools that only compare directional candle agreement between two assets, this script transforms correlation events into actionable market zones, while also managing their lifecycle through objective invalidation rules.
🔍 Core Concept
PSP (Price Structure Parity) identifies situations where:
The current asset shows a bullish candle while the reference asset is bearish, or vice versa (direct mode)
Or both assets move in the same direction under inverse correlation logic
These conditions highlight temporary structural dislocations between correlated instruments, often driven by liquidity imbalance or delayed price response.
🧠 How It Works
1. Cross-Asset Structure Comparison
The script compares:
Current chart candles
Reference symbol candles (user-defined)
It evaluates directional alignment or divergence depending on selected mode:
Direct correlation mode
Inverse correlation mode
2. PSP Signal Generation
A PSP event is triggered when a structural mismatch occurs between the two assets based on candle direction.
Signals are classified into:
Bullish PSP
Bearish PSP
3. Zone Construction (Key Feature)
Instead of simply coloring candles, each PSP event generates a price zone, representing:
The full body range of the signal candle
A contextual imbalance area where correlation deviation occurred
Zones remain active on the chart and provide a visual representation of where structural inefficiencies were identified.
4. Invalidation Mechanism
Each zone has a lifecycle and is automatically removed when invalidated:
Bullish zones are invalidated when price closes below the zone
Bearish zones are invalidated when price closes above the zone
This ensures only active and relevant market structures remain visible, eliminating visual noise and outdated signals.
📊 Key Features
Cross-asset correlation detection (PSP model)
Direct and inverse correlation modes
Zone-based visualization instead of single-bar signals
Automatic invalidation of broken structures
Clean and low-noise chart output
Suitable for multi-asset analysis
⚙️ Inputs
Reference Symbol – asset used for correlation comparison
Inverse Correlation Mode – flips correlation logic
Color Theme Selector – customizable visual styles
Opacity Control – zone transparency adjustment
🧭 How to Use
This indicator is best applied in:
Correlated crypto pairs (e.g., BTC/ETH, BTC/ALTS)
Index vs single asset analysis
Liquidity divergence identification
Typical workflow:
Wait for PSP zone creation
Observe price reaction inside the zone
Monitor invalidation level for structural confirmation
Use zones as context for entries or confirmations
⚠️ Notes
This indicator does not repaint historical PSP zones
Signals are based on closed candle structure
Best results occur when used with correlated liquid assets
🇷🇺 Description (RU — дополнительный перевод)
Этот индикатор реализует модель корреляционных структур PSP (Price Structure Parity) и превращает расхождения между активами в торговые зоны ликвидности.
В отличие от стандартных индикаторов корреляции, он не просто сравнивает направление свечей, а формирует:
структурные зоны дисбаланса
визуальные области интереса
автоматическую инвалидацию сломанных структур
🧠 Логика работы
Индикатор сравнивает:
свечи текущего графика
свечи выбранного референс-актива
При выявлении расхождения формируется PSP-сигнал:
бычий
медвежий
📊 Зоны
Каждый сигнал превращается в зону (box), которая показывает:
область структурного дисбаланса
потенциальную зону реакции цены
❌ Инвалидация
Зона удаляется при:
пробое вниз (для бычьей зоны)
пробое вверх (для медвежьей зоны)
🎯 Применение
Лучше всего работает:
на криптовалютах с высокой корреляцией
в анализе BTC vs альткоины
при поиске реакций от дисбаланса
Unlike traditional correlation tools that only compare directional candle agreement between two assets, this script transforms correlation events into actionable market zones, while also managing their lifecycle through objective invalidation rules.
🔍 Core Concept
PSP (Price Structure Parity) identifies situations where:
The current asset shows a bullish candle while the reference asset is bearish, or vice versa (direct mode)
Or both assets move in the same direction under inverse correlation logic
These conditions highlight temporary structural dislocations between correlated instruments, often driven by liquidity imbalance or delayed price response.
🧠 How It Works
1. Cross-Asset Structure Comparison
The script compares:
Current chart candles
Reference symbol candles (user-defined)
It evaluates directional alignment or divergence depending on selected mode:
Direct correlation mode
Inverse correlation mode
2. PSP Signal Generation
A PSP event is triggered when a structural mismatch occurs between the two assets based on candle direction.
Signals are classified into:
Bullish PSP
Bearish PSP
3. Zone Construction (Key Feature)
Instead of simply coloring candles, each PSP event generates a price zone, representing:
The full body range of the signal candle
A contextual imbalance area where correlation deviation occurred
Zones remain active on the chart and provide a visual representation of where structural inefficiencies were identified.
4. Invalidation Mechanism
Each zone has a lifecycle and is automatically removed when invalidated:
Bullish zones are invalidated when price closes below the zone
Bearish zones are invalidated when price closes above the zone
This ensures only active and relevant market structures remain visible, eliminating visual noise and outdated signals.
📊 Key Features
Cross-asset correlation detection (PSP model)
Direct and inverse correlation modes
Zone-based visualization instead of single-bar signals
Automatic invalidation of broken structures
Clean and low-noise chart output
Suitable for multi-asset analysis
⚙️ Inputs
Reference Symbol – asset used for correlation comparison
Inverse Correlation Mode – flips correlation logic
Color Theme Selector – customizable visual styles
Opacity Control – zone transparency adjustment
🧭 How to Use
This indicator is best applied in:
Correlated crypto pairs (e.g., BTC/ETH, BTC/ALTS)
Index vs single asset analysis
Liquidity divergence identification
Typical workflow:
Wait for PSP zone creation
Observe price reaction inside the zone
Monitor invalidation level for structural confirmation
Use zones as context for entries or confirmations
⚠️ Notes
This indicator does not repaint historical PSP zones
Signals are based on closed candle structure
Best results occur when used with correlated liquid assets
🇷🇺 Description (RU — дополнительный перевод)
Этот индикатор реализует модель корреляционных структур PSP (Price Structure Parity) и превращает расхождения между активами в торговые зоны ликвидности.
В отличие от стандартных индикаторов корреляции, он не просто сравнивает направление свечей, а формирует:
структурные зоны дисбаланса
визуальные области интереса
автоматическую инвалидацию сломанных структур
🧠 Логика работы
Индикатор сравнивает:
свечи текущего графика
свечи выбранного референс-актива
При выявлении расхождения формируется PSP-сигнал:
бычий
медвежий
📊 Зоны
Каждый сигнал превращается в зону (box), которая показывает:
область структурного дисбаланса
потенциальную зону реакции цены
❌ Инвалидация
Зона удаляется при:
пробое вниз (для бычьей зоны)
пробое вверх (для медвежьей зоны)
🎯 Применение
Лучше всего работает:
на криптовалютах с высокой корреляцией
в анализе BTC vs альткоины
при поиске реакций от дисбаланса
开源脚本
秉承TradingView的精神,该脚本的作者将其开源,以便交易者可以查看和验证其功能。向作者致敬!您可以免费使用该脚本,但请记住,重新发布代码须遵守我们的网站规则。

Ежедневная аналитика рынка, торговые сценарии и дополнительные материалы:
t.me/crypto_maniacdt
BingX — скидка 25% на торговые комиссии и приветственные бонусы до 11 000 USDT:
bingxdao.com/partner/maniacdt/
t.me/crypto_maniacdt
BingX — скидка 25% на торговые комиссии и приветственные бонусы до 11 000 USDT:
bingxdao.com/partner/maniacdt/
免责声明
这些信息和出版物并非旨在提供,也不构成TradingView提供或认可的任何形式的财务、投资、交易或其他类型的建议或推荐。请阅读使用条款了解更多信息。
开源脚本
秉承TradingView的精神,该脚本的作者将其开源,以便交易者可以查看和验证其功能。向作者致敬!您可以免费使用该脚本,但请记住,重新发布代码须遵守我们的网站规则。
Ежедневная аналитика рынка, торговые сценарии и дополнительные материалы:
t.me/crypto_maniacdt
BingX — скидка 25% на торговые комиссии и приветственные бонусы до 11 000 USDT:
bingxdao.com/partner/maniacdt/
t.me/crypto_maniacdt
BingX — скидка 25% на торговые комиссии и приветственные бонусы до 11 000 USDT:
bingxdao.com/partner/maniacdt/
免责声明
这些信息和出版物并非旨在提供,也不构成TradingView提供或认可的任何形式的财务、投资、交易或其他类型的建议或推荐。请阅读使用条款了解更多信息。