OPEN-SOURCE SCRIPT
Volume Strength Shift [MMT]
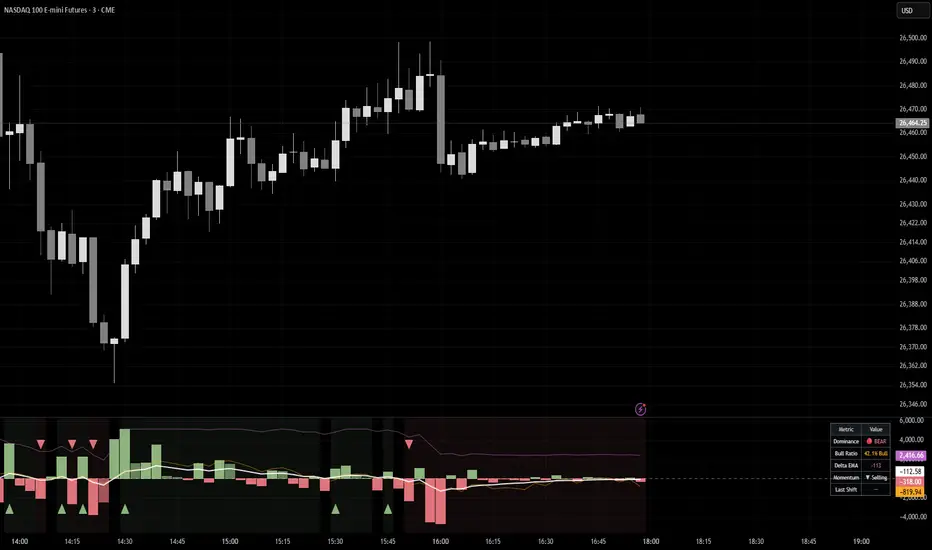
Volume Strength Shift [MMT] helps you see when buying or selling pressure is starting to take control. It breaks each candle’s volume into a bull side and a bear side, then highlights when one side begins to dominate.
This indicator is built to make volume easier to read at a glance. Green areas show bullish strength, red areas show bearish strength, and the shift arrows point out when momentum is changing. The smoothed delta line, bull ratio line, and scaled CVD line give you extra confirmation without making the chart too complicated. TradingView’s own volume delta tools also focus on comparing buying and selling pressure to help traders judge sentiment and momentum.
How to Use It
Best For
Spotting momentum shifts early.
What It Shows
Simple Idea
If price is moving up but the indicator is still red or neutral, the move may be weak. If price flips up and the indicator turns green at the same time, that gives you stronger confirmation that buyers are stepping in.
This indicator is built to make volume easier to read at a glance. Green areas show bullish strength, red areas show bearish strength, and the shift arrows point out when momentum is changing. The smoothed delta line, bull ratio line, and scaled CVD line give you extra confirmation without making the chart too complicated. TradingView’s own volume delta tools also focus on comparing buying and selling pressure to help traders judge sentiment and momentum.
How to Use It
- Look for a bull shift when the indicator turns green and the bullish arrow appears.
- Look for a bear shift when the indicator turns red and the bearish arrow appears.
- Use the background tint to quickly see which side is in control.
- Use the CVD and bull ratio lines to confirm whether strength is building or fading.
Best For
Spotting momentum shifts early.
- Confirming entries on CBC or other momentum-based strategies.
- Filtering out weak or low-conviction moves.
- Understanding whether volume is supporting the current trend.
What It Shows
- Histogram bars: volume strength by direction.
- Smoothed delta: the main trend of volume pressure.
- Bull ratio line: how much of volume is leaning bullish.
- Scaled CVD line: the running balance of buying vs. selling pressure.
- Shift arrows: when dominance changes from one side to the other.
Simple Idea
If price is moving up but the indicator is still red or neutral, the move may be weak. If price flips up and the indicator turns green at the same time, that gives you stronger confirmation that buyers are stepping in.
开源脚本
秉承TradingView的精神,该脚本的作者将其开源,以便交易者可以查看和验证其功能。向作者致敬!您可以免费使用该脚本,但请记住,重新发布代码须遵守我们的网站规则。

免责声明
这些信息和出版物并非旨在提供,也不构成TradingView提供或认可的任何形式的财务、投资、交易或其他类型的建议或推荐。请阅读使用条款了解更多信息。
开源脚本
秉承TradingView的精神,该脚本的作者将其开源,以便交易者可以查看和验证其功能。向作者致敬!您可以免费使用该脚本,但请记住,重新发布代码须遵守我们的网站规则。
免责声明
这些信息和出版物并非旨在提供,也不构成TradingView提供或认可的任何形式的财务、投资、交易或其他类型的建议或推荐。请阅读使用条款了解更多信息。