OPEN-SOURCE SCRIPT
ICT HTF FVGs
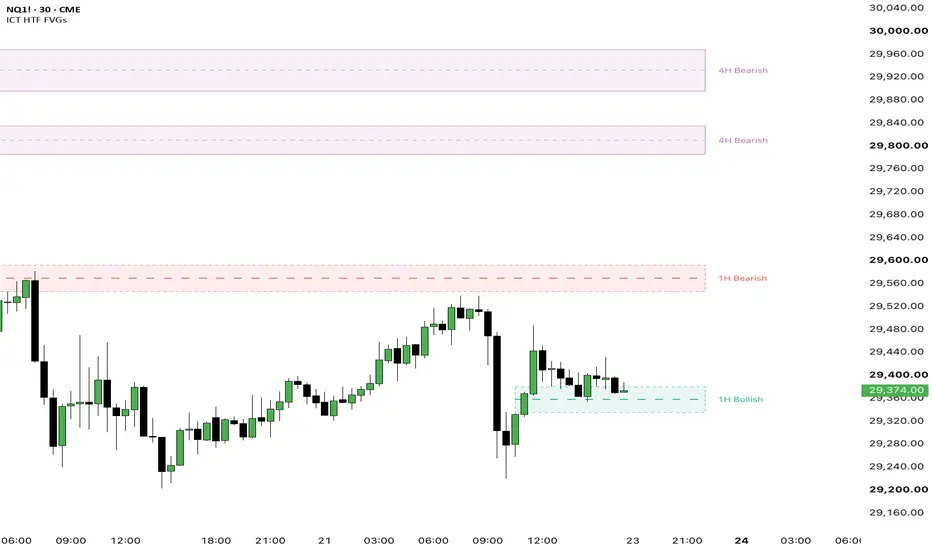
Higher Timeframe Fair Value Gaps with CE and Quarter Levels
What it does
This script draws fair value gaps from two higher timeframes onto the chart you are already looking at, so a 4-hour or daily gap stays visible while you work on a 5-minute chart. Each gap is drawn as a zone anchored at the time the pattern actually formed, with a consequent encroachment (CE) line at its midpoint, and the script then tracks what price does with that zone afterwards: left alone, entered, reached at the CE line, or traded all the way through. Both higher timeframes are chosen by you, and every filter, colour, and lifecycle rule is a setting.
How it works
A fair value gap is a three-candle pattern where the middle candle moves far enough that the first and third candles do not overlap, leaving a price range that was passed through in one direction without trading in the other. The script evaluates that pattern on each selected higher timeframe and projects the resulting zone onto the chart's own bar index, both for its left edge and for any offset applied to its right edge, which is what keeps a weekly zone on the correct spot of an intraday chart and keeps an offset from ever landing inside a trading pause.
How to use it
Inputs
Settings that only apply under a condition are greyed out until that condition is met, so an inactive option cannot be changed by mistake.
Signals and alerts
Every alert fires once per bar close. Each type fires at most once per bar; the message names the direction and timeframe of the zone nearest to price and, if others made the same move on the same close, how many. Require Displacement is on by default, which lowers how many gaps are drawn in the first place and therefore how often these alerts fire; turn it off to see and be alerted on every structural gap again.
Repainting
Every value used to build a zone is read from bars that have already closed on their own timeframe. The request is offset by at least one bar and paired with lookahead, which is the combination that returns the last completed higher-timeframe bar rather than the one still forming. A zone therefore appears at the close of the third candle of its pattern and never moves afterwards, and state changes are only evaluated on confirmed bars. The visible consequence is deliberate: a gap forming inside a running 4-hour candle is not drawn until that candle closes. Showing it earlier would mean drawing a zone whose edge can still move, because the low of an unfinished candle can fall further and close the gap again.
Limitations
This script is a charting tool for educational purposes. It does not provide
financial advice and does not predict future price movement. Trading carries
risk; decisions and their outcome remain yours.
What it does
This script draws fair value gaps from two higher timeframes onto the chart you are already looking at, so a 4-hour or daily gap stays visible while you work on a 5-minute chart. Each gap is drawn as a zone anchored at the time the pattern actually formed, with a consequent encroachment (CE) line at its midpoint, and the script then tracks what price does with that zone afterwards: left alone, entered, reached at the CE line, or traded all the way through. Both higher timeframes are chosen by you, and every filter, colour, and lifecycle rule is a setting.
How it works
A fair value gap is a three-candle pattern where the middle candle moves far enough that the first and third candles do not overlap, leaving a price range that was passed through in one direction without trading in the other. The script evaluates that pattern on each selected higher timeframe and projects the resulting zone onto the chart's own bar index, both for its left edge and for any offset applied to its right edge, which is what keeps a weekly zone on the correct spot of an intraday chart and keeps an offset from ever landing inside a trading pause.
- A bullish gap exists when the third candle's low is above the first candle's high. The zone spans that distance, and price returns into it from above.
- A bearish gap exists when the third candle's high is below the first candle's low. The zone spans that distance, and price returns into it from below.
- The CE line sits at the exact midpoint of the zone. The optional quarter lines sit at 25 % and 75 % of it.
- Each zone moves through four states: open, touched, CE reached, and mitigated. The border style and the fill opacity show which state a zone is in.
- A zone is only created once all three candles of its pattern have closed on their own timeframe. Nothing is drawn from a candle that is still forming.
- Optional filters can reject a gap before it is drawn: direction, the trend of its own timeframe, the quality of the middle candle, and the time window it formed in.
How to use it
- Add the script and set the two higher timeframes you follow. Both must be at or above the chart timeframe; a lower one is switched off and named on the chart.
- Read the zones as areas price has left behind, not as signals. The colour tells you which timeframe and direction a zone belongs to, the label repeats it in text.
- Watch the state. A solid border means untouched, a dashed border means price has been inside, a faded zone has been traded through completely. There is no legend on the chart; the colour tied to each timeframe is set in the Style group of the settings.
- Require Displacement is on by default and removes gaps left by quiet candles. Turn on the remaining filters one at a time if there are still more zones than you want.
- Set Extend Zones to match how you read a chart: ending a fixed number of bars right of price, freezing where a zone was traded through, or running to the right edge.
Inputs
- Timeframes - two independent slots, each with an on/off switch and its own timeframe. A slot below the chart timeframe is ignored.
- Direction - keep both directions, or only bullish or only bearish gaps.
- Require Displacement - on by default. Demands that the middle candle's body covers at least a chosen share of its range, optionally that its range reaches a multiple of the ATR of its own timeframe. Body share 0-100 %, default 50; ATR multiple 0-10, default 0 which switches that half off.
- Trend Filter - compares the close of the last completed bar of the slot timeframe with an EMA on that same timeframe, and keeps only gaps with or against that direction. EMA length 2-500, default 50.
- Session Filter - keeps only gaps whose middle candle starts inside a chosen window, in a chosen timezone. A slot on a daily timeframe or higher ignores it.
- Interaction Basis - whether a bar's wick or only its close counts as reaching a zone, its CE line, or its far edge.
- Mitigation Basis - HTF Bar Close advances a zone only when a bar of its own timeframe closes; Chart Bar advances it on every closed chart bar.
- Zones Per Timeframe - how many zones each slot keeps before the oldest is removed. Range 1-20, default 3.
- Extend Zones - To Current Bar keeps open zones ending a set number of bars right of price, Until Mitigated freezes a zone where it was traded through, Always runs every zone to the right edge. Right Offset 0-200 bars, default 10.
- Labels - content and text size as a number from 8 to 40, default 12. Position is fixed just outside the right edge of the zone, at CE height.
- Style - a bullish and a bearish colour per slot, fill opacity, mitigated opacity, border width where zero draws no border, and the CE line style and width.
Settings that only apply under a condition are greyed out until that condition is met, so an inactive option cannot be changed by mistake.
Signals and alerts
- New FVG formed - a new zone has been created on one of the two timeframes.
- FVG entered - price has reached into a zone for the first time.
- CE reached - price has reached the midpoint of a zone.
- FVG mitigated - price has traded through an entire zone.
Every alert fires once per bar close. Each type fires at most once per bar; the message names the direction and timeframe of the zone nearest to price and, if others made the same move on the same close, how many. Require Displacement is on by default, which lowers how many gaps are drawn in the first place and therefore how often these alerts fire; turn it off to see and be alerted on every structural gap again.
Repainting
Every value used to build a zone is read from bars that have already closed on their own timeframe. The request is offset by at least one bar and paired with lookahead, which is the combination that returns the last completed higher-timeframe bar rather than the one still forming. A zone therefore appears at the close of the third candle of its pattern and never moves afterwards, and state changes are only evaluated on confirmed bars. The visible consequence is deliberate: a gap forming inside a running 4-hour candle is not drawn until that candle closes. Showing it earlier would mean drawing a zone whose edge can still move, because the low of an unfinished candle can fall further and close the gap again.
Limitations
- A zone appears only when the higher-timeframe candle that completes it has closed. On a daily slot that can be hours after the move that created the gap.
- On a low chart timeframe the loaded history may not reach back far enough to show older zones of a high timeframe, because the zone's left edge sits on a bar index that predates what is currently loaded.
- The session filter has no meaning on a daily timeframe or higher and is skipped there, so a slot on daily will show gaps from outside the chosen window.
- A timeframe below the chart timeframe cannot be projected meaningfully and is switched off rather than approximated.
- The script marks where gaps are and what price has done with them. It does not judge whether a gap will be filled, and it produces no entries, exits, or directional calls.
- Only chart bars and higher timeframes are used. No tick data, no volume-derived values, so nothing here depends on the data plan of the account.
This script is a charting tool for educational purposes. It does not provide
financial advice and does not predict future price movement. Trading carries
risk; decisions and their outcome remain yours.
开源脚本
秉承TradingView的精神,该脚本的作者将其开源,以便交易者可以查看和验证其功能。向作者致敬!您可以免费使用该脚本,但请记住,重新发布代码须遵守我们的网站规则。

Find my advanced premium indicators:
kronosindicators.com
kronosindicators.com
免责声明
这些信息和出版物并非旨在提供,也不构成TradingView提供或认可的任何形式的财务、投资、交易或其他类型的建议或推荐。请阅读使用条款了解更多信息。
开源脚本
秉承TradingView的精神,该脚本的作者将其开源,以便交易者可以查看和验证其功能。向作者致敬!您可以免费使用该脚本,但请记住,重新发布代码须遵守我们的网站规则。
Find my advanced premium indicators:
kronosindicators.com
kronosindicators.com
免责声明
这些信息和出版物并非旨在提供,也不构成TradingView提供或认可的任何形式的财务、投资、交易或其他类型的建议或推荐。请阅读使用条款了解更多信息。