已更新
Multiple Percentile Ranks (up to 5 sources at a time)
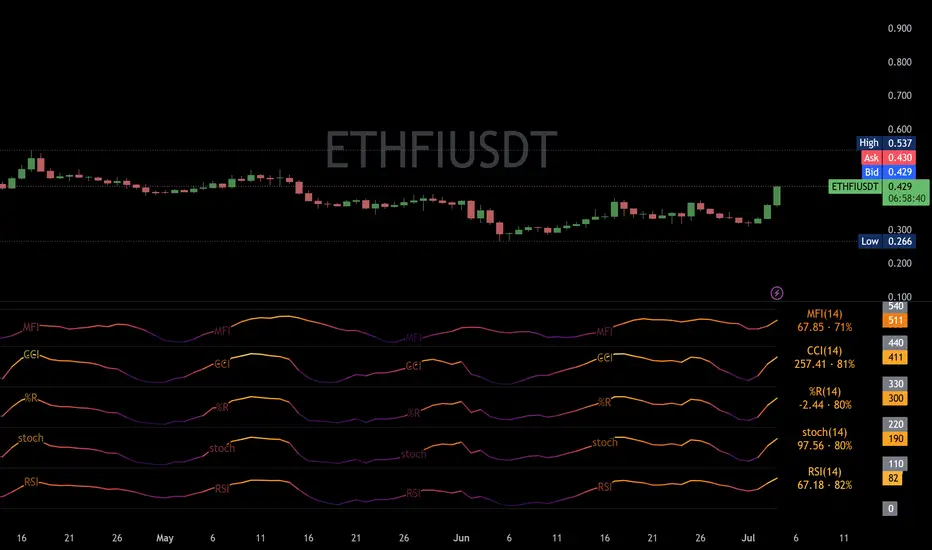
This indicator is a visual percentile rank indicator that can display 1 to 5 sources at one time.
The options:
“Sources”
Choose the number of sources you would like to display. The minimum is 1, the maximum is 5.
“Label percent position”
The label for the current percentage of where the source candle ranks.
“Label position”
This displays the source/s you’ve selected, and the chosen bottom rank % and top rank %.
“Label text size”
Displays the text size of all labels.
“Display current % labels”
Switches the labels on/off only for the current percentage rank of each source.
Source options:
ATR: Average True Range
CCI: Commodity Channel Index
COG: Centre of Gravity
Close: closing price
Close Percent: close percentage from previous close
Dollar Value: volume * (high * low * close / 3)
EOM: Ease of Movement: how much volume it takes to move the price in a certain direction
OBV: On-Balance Volume
RANGE: percentage range of the close price
RSI: Relative Strength Index
RVI: Relative Vigor Index
Time Close: if you select the 1 second timeframe it will provide the gap of time between each 1 second close
Volume: each bar’s volume
Volume (MA): volume moving average
Source # where # is the number of the source. Selects the source you’d like.
Ma Length is the number of previous candles to consider when calculating the moving average of the source. Note, the “MA Length” only applies to sources that have the “(MA)” at the end of their name.
Bottom % is the bottom percentage rank of the source you’ve selected. This is a filter to display the candle line graph in red once the percentage rank is equal to the percentage you’ve chosen or below.
Top % is the top percentage rank of the source you’ve selected. This is a filter to display the candle line graph in green once the percentage rank is equal to the percentage you’ve chosen or higher.
A simple example of how to use the indicator:
Select the dropdown menu for source 1 and select volume.
As the candles populate, it will look at previous candles and assign a percentage rank of where the candles are in relation to previous candles.
*Note, the way Tradingview works is it will populate the first candle the chart was active, and continue on. So, let’s say the 3rd candle was the highest volume day. This candle will show up as 100%. If the next day, the 4th candle has an even higher volume, it will show up as 100% also, the previous candles won’t “repaint” to other values and are instead set based on when they were confirmed. So, this indicator works best when there are a lot of previous candles to compare itself to.
To use the bottom % rank filter enter a percentage such as 5%. As it comes across a candle that is 5% or less compared to previous volume candles, then the line graph will shade in red.
The same can be said for the top % rank. So, if you want to see the line graph change to green when it comes across the top 99th percentile rank of volume bars, then set the top % rank to 1% and it will give you extremely high-volume bars in green instead of blue.
The options:
“Sources”
Choose the number of sources you would like to display. The minimum is 1, the maximum is 5.
“Label percent position”
The label for the current percentage of where the source candle ranks.
“Label position”
This displays the source/s you’ve selected, and the chosen bottom rank % and top rank %.
“Label text size”
Displays the text size of all labels.
“Display current % labels”
Switches the labels on/off only for the current percentage rank of each source.
Source options:
ATR: Average True Range
CCI: Commodity Channel Index
COG: Centre of Gravity
Close: closing price
Close Percent: close percentage from previous close
Dollar Value: volume * (high * low * close / 3)
EOM: Ease of Movement: how much volume it takes to move the price in a certain direction
OBV: On-Balance Volume
RANGE: percentage range of the close price
RSI: Relative Strength Index
RVI: Relative Vigor Index
Time Close: if you select the 1 second timeframe it will provide the gap of time between each 1 second close
Volume: each bar’s volume
Volume (MA): volume moving average
Source # where # is the number of the source. Selects the source you’d like.
Ma Length is the number of previous candles to consider when calculating the moving average of the source. Note, the “MA Length” only applies to sources that have the “(MA)” at the end of their name.
Bottom % is the bottom percentage rank of the source you’ve selected. This is a filter to display the candle line graph in red once the percentage rank is equal to the percentage you’ve chosen or below.
Top % is the top percentage rank of the source you’ve selected. This is a filter to display the candle line graph in green once the percentage rank is equal to the percentage you’ve chosen or higher.
A simple example of how to use the indicator:
Select the dropdown menu for source 1 and select volume.
As the candles populate, it will look at previous candles and assign a percentage rank of where the candles are in relation to previous candles.
*Note, the way Tradingview works is it will populate the first candle the chart was active, and continue on. So, let’s say the 3rd candle was the highest volume day. This candle will show up as 100%. If the next day, the 4th candle has an even higher volume, it will show up as 100% also, the previous candles won’t “repaint” to other values and are instead set based on when they were confirmed. So, this indicator works best when there are a lot of previous candles to compare itself to.
To use the bottom % rank filter enter a percentage such as 5%. As it comes across a candle that is 5% or less compared to previous volume candles, then the line graph will shade in red.
The same can be said for the top % rank. So, if you want to see the line graph change to green when it comes across the top 99th percentile rank of volume bars, then set the top % rank to 1% and it will give you extremely high-volume bars in green instead of blue.
版本注释
Enhanced the user interface and refined fill conditions.Inputs labeled with (%R) use percent rank, comparing the current value to past bars within the set size limit.
For example, with a 100-bar limit, if volume is at its lowest in that range, it will display as 0% or 1%, indicating the lowest volume within those 100 bars.
RSI and MFI do not use percent rank; they maintain their standard values.
Fills highlight areas when a specified level is reached, improving visual clarity.
Large price movements often follow prolonged flat ranges when volume increases alongside the close position (relative to the candlestick's range).
Experiment to find what works best for you.
版本注释
MULTIPLE INDICATORS 2.0 — every metric, one language, one paneComplete redesign. Up to TEN metrics, each translated into the same honest language — a 0-100
PERCENTILE RANK of its own recent history — and stacked vertically in one pane (each slot 110
above the last) so they never overlap. One glance answers: "which of my metrics are unusual
RIGHT NOW?"
━━━ WHAT A SLOT CAN RANK ━━━
volume · dollar value · RSI · MFI · Stochastic %K · CCI · Williams %R · ROC % · ADX ·
true range % · ATR % · stdev volatility % · stretch from EMA50 % · body/range % ·
drawdown from N-bar high % · gap % · time between bars · move per volume ·
tick activity (intrabar) · up-volume share % (intrabar) · plus TWO EXTERNAL slots —
add any indicator to your chart, pick its plot, and it joins the dashboard.
Because everything is a rank of its own history, apples compare to apples: "volume at its 97th
percentile" and "RSI at its 12th" mean the same kind of thing, on the same 0-100 scale.
(Yes, Stochastic is ranked too — everything is, no silent exceptions.)
━━━ READING IT ━━━
• Two color modes: SHARED PALETTE — every line speaks the same heat language, cold at 0,
brightest at 100 (Inferno / Viridis / Plasma / Ice & fire / Green to red / Diverging /
Monochrome / 5-stop Custom) — or PER-SLOT COLORS, where each indicator keeps its own identity
color, dim when its rank is low and vivid at 100, so ten stacked lines are instantly tellable
apart. Slot color themes: Vivid · Pastel · Neon · Okabe-Ito (colorblind-safe) · Custom (ten
pickers).
• Each slot carries an outlined label: name(length) · current value · rank %.
Full text-size range, readable on any background.
• Inline name tags print ON each line every N bars (interval, transparency and size yours) —
scroll back through history and every line still tells you what it is.
• Alerts (one alert → "Any alert() function call") when any slot ENTERS its extreme high/low
percentile — the message names the metrics that fired.
━━━ PRESETS ━━━
Momentum core (RSI·Stoch·%R·CCI·MFI) · Volume & flow · Volatility scan · Fast scalper ·
Swing / macro · User defined (10 slot dropdowns + lengths are yours).
━━━ HONESTY ━━━
Ranks are computed against CLOSED bars only, over a window you control; each slot stays gray
until ~20 bars of history exist. Percentile ranks are context, not signals. Not financial advice.
Portions of this script were developed with AI assistance; all logic was reviewed and tested by me.
━━━ CHANGELOG (2.0) ━━━
• Fixed: selecting On Balance Volume / Price-Volume Trend produced a silent blank plot with a
"NaN" label — the formula table is now shared by menu, math and labels, so nothing can drift.
• Fixed: "bars to consider" set to 0 could crash the indicator.
• Fixed: two dropdown options ("distance per volume unit" / "per currency unit") computed the
identical formula; zero-volume bars could poison the rank window with infinities.
• Performance: labels were created and deleted 20x on EVERY historical bar — the main cause of
"calculation took too long" on long charts. They are now drawn once and updated in place on
the last bar only. Unused slots also no longer do any ranking work, and the rank window is
capped at a sane maximum (the old 100,000-bar setting invited freezes).
• Added: intrabar tick metrics, external source slots, palettes, presets, extreme alerts,
tooltips, and full label size range.
• Changed: every metric is now genuinely percentile-ranked (the old version quietly plotted
Stochastic and close-position as raw values among the ranks).

免责声明
这些信息和出版物并非旨在提供,也不构成TradingView提供或认可的任何形式的财务、投资、交易或其他类型的建议或推荐。请阅读使用条款了解更多信息。
免责声明
这些信息和出版物并非旨在提供,也不构成TradingView提供或认可的任何形式的财务、投资、交易或其他类型的建议或推荐。请阅读使用条款了解更多信息。