OPEN-SOURCE SCRIPT
Displaced Donchian Breakout [NJ]
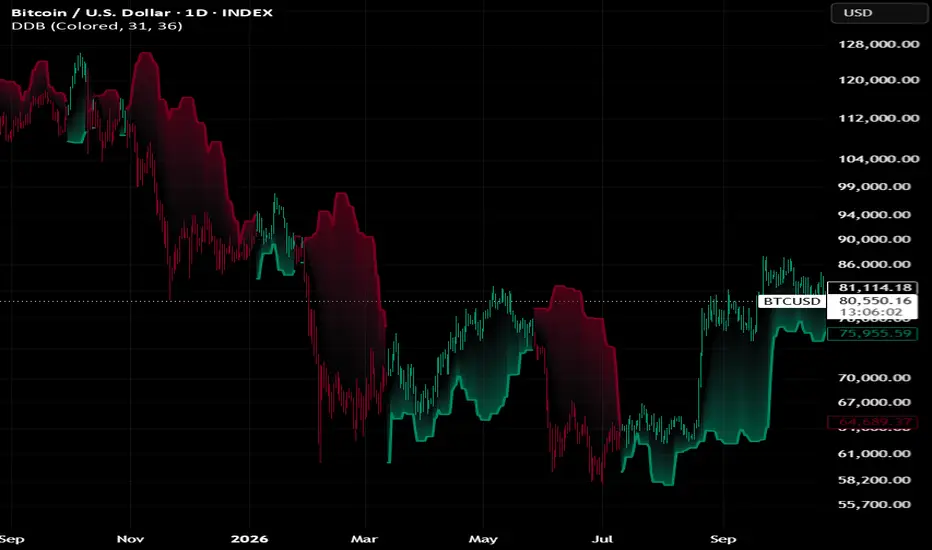
✧ OVERVIEW ✧
Displaced Donchian Breakout is a trend-following breakout indicator that builds Donchian-style bands from a lookback window placed further in the past instead of from the most recent candles.
Upper band is the highest high and lower band is the lowest low of a selected group of older candles. Recent price action is skipped, so the bands represent an earlier price range rather than the latest swing highs and lows.
Price breaking beyond the displaced bands determines the current bullish or bearish condition, which is displayed using colored candles, an active band and a gradient glow.
✧ SETTINGS ✧
Color Mode
Switches between colored and neutral visualization.
Color Candles
Shows or hides candle coloring based on the current signal.
Start Length
Controls how many recent bars are skipped before the lookback window begins.
End Length
Controls how far back the lookback window ends. The number of candles in the window equals End Length minus Start Length.
✧ HOW IT WORKS ✧
Displaced Lookback Window
A classic Donchian Channel uses the highest high and lowest low of the most recent candles. This indicator skips the most recent candles and only looks at an older section of price.
Upper Band = Highest high of the candles from Start Length + 1 to End Length bars ago
Lower Band = Lowest low of the candles from Start Length + 1 to End Length bars ago
Band Behavior
Because the window moves forward one candle at a time, the bands follow how price behaved in the past rather than reacting to every new high or low.
When the older window contained a strong move or a volatile period, the bands widen. When it contained a quiet range, the bands tighten.
Signal Logic
A bullish condition is activated when the high of a candle moves above the upper band.
A bearish condition is activated when the low of a candle moves below the lower band.
If both happen on the same candle, the bearish condition takes priority.
Active condition remains unchanged until the opposite condition occurs.
✧ VISUALIZATION ✧
Green represents a bullish condition.
Red represents a bearish condition.
Neutral mode displays the same conditions using light and dark shades.
During a bullish condition, lower band is displayed in green.
During a bearish condition, upper band is displayed in red.
A gradient glow fills the area between the active band and a 10-period simple moving average of closing price. It is strongest at the band and fades toward price.
Same signal colors can optionally be applied directly to the chart candles.
✧ USAGE ✧
Displaced Donchian Breakout can be used to identify:
Bullish and bearish trend conditions
Breakouts beyond previous price ranges
Trailing support and resistance levels
Directional market bias
Trend confirmation
Additional confirmation for other technical analysis
Using an older price range is designed to require price to move beyond where the market traded earlier, rather than reacting to short-term swing highs and lows.
As with any technical indicator, it is best used alongside other forms of analysis rather than as a standalone entry or exit signal.
开源脚本
秉承TradingView的精神,该脚本的作者将其开源,以便交易者可以查看和验证其功能。向作者致敬!您可以免费使用该脚本,但请记住,重新发布代码须遵守我们的网站规则。

免责声明
这些信息和出版物并非旨在提供,也不构成TradingView提供或认可的任何形式的财务、投资、交易或其他类型的建议或推荐。请阅读使用条款了解更多信息。
免责声明
这些信息和出版物并非旨在提供,也不构成TradingView提供或认可的任何形式的财务、投资、交易或其他类型的建议或推荐。请阅读使用条款了解更多信息。