OPEN-SOURCE SCRIPT
已更新 Trend Sniper v2.5 [Jamallo]
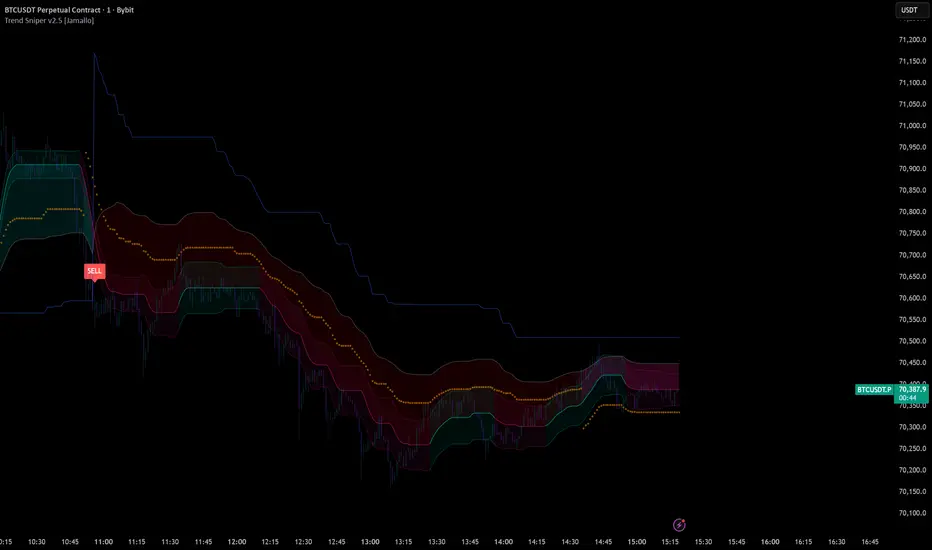
(2025)
Intro
Trend Sniper v2.5 is built around a novel-unique core construction —
the Butterworth Stop: a ratcheting trailing stop anchored to a 2-Pole Butterworth Super Smoother and dynamically sized by Parkinson Volatility.
While each algorithm used is individually well-documented, this specific combination is rare and not found in standard indicator libraries — most Butterworth implementations are simply plotted as trend lines, not used as the structural anchor of a volatility-adaptive stop mechanism.
Break down:
2-Pole Butterworth Super Smoother (Core Trend Line) (smoothed price)
The backbone of the indicator is a 2-Pole Butterworth Super Smoother, a concept brought into trading by engineer and author John Ehlers, first published in his 2004 book Cybernetic Analysis for Stocks and Futures
In this indicator: The Butterworth filter runs onPine Script® with a user-defined period (default 20) and produces Pine Script® — a clean, lag-minimized version of price. This smoothed value is not plotted directly. Instead, it acts as the anchor point for the trailing stop. The stop is placed at Pine Script® , meaning the stop hugs the filtered trend rather than raw price, making it far less susceptible to wick noise and erratic bars. Without this pre-filtering step, the trailing stop would oscillate erratically on volatile bars.
Parkinson Volatility (Sizes the Stop Distance)
"Developed by physicist Michael Parkinson in 1980, it estimates volatility using the natural logarithm of the high-to-low ratio each period, capturing intraday range rather than just close-to-close movement."
In this indicator: Parkinson Volatility is calculated over a rolling window (default 50 bars) and multiplied byPine Script® (default 1.2) to produce Pine Script® . When markets are volatile, Pine Script® expands and the stop gives price more room. When markets are quiet, it contracts and the stop tightens.
Butterworth Stop State Machine (The Main Line You Watch)
This is the primary plotted line, It's a classic ratcheting trailing stop built on top of outputs from steps 1 and 2.
In this indicator: The logic is a simple state machine with two modes — uptrend and downtrend. In an uptrend, the stop only moves up (never down), tracking atPine Script® . In a downtrend, it only moves down, tracking atPine Script® . When price closes on the wrong side of the stop, the state flips and the stop resets on the other side of the trend line. Because both the anchor Pine Script® and the buffer Pine Script® are noise-filtered and volatility-adjusted, the BW Stop flips far less often than a raw price-based trailing stop would, keeping you in trends longer.
Chande Momentum Oscillator + Deadband (Colors the BW Stop Line)
"The CMO measures momentum by calculating the difference between the sum of gains and the sum of losses over a specified period, dividing by their total to produce a normalized scale from -100 to +100 that accounts for both up and down days simultaneously."
In this indicator: CMO is calculated onPine Script® itself (not raw price), over 14 bars by default. A deadband of ±10 is applied — the line only turns bull-colored when CMO exceeds +10, and bear-colored when it drops below −10. It does not change color in between.
KAMA Midpoint (The Dynamic Midline and Fill Zone Anchor)
"Introduced by Perry Kaufman in 1995, KAMA dynamically adjusts its smoothing based on the relative efficiency of price movement".
In this indicator: Rather than applying KAMA to price directly, it's applied to the midpoint between the BW Stop and the Slow SuperTrend. This midpoint is a computed halfway value between the two lines. KAMA then smooths that midpoint adaptively, producing `kama_mid`. The fill colors you see on the chart are drawn betweenPine Script® and Pine Script® — not between price and anything else.
Dual SuperTrend (Signals and Fill State Logic)
"Created by Olivier Seban, SuperTrend combines ATR-based volatility with trend detection into a single line that repositions dynamically as price confirms or breaks the current trend direction."
In this indicator: Two SuperTrend lines run simultaneously.
Putting It All Together
The flow through the indicator is linear: Butterworth smooths price → Parkinson sizes the stop → the state machine builds the stop line → CMO colors it → KAMA anchors the midline fill → the dual SuperTrend fires signals and shades conviction.
END
Every component feeds the next, meaning the final signals and visuals are the product of five sequential filters rather than any single calculation — which is what gives the indicator its resistance to false signals in noisy market conditions.
Intro
Trend Sniper v2.5 is built around a novel-unique core construction —
the Butterworth Stop: a ratcheting trailing stop anchored to a 2-Pole Butterworth Super Smoother and dynamically sized by Parkinson Volatility.
While each algorithm used is individually well-documented, this specific combination is rare and not found in standard indicator libraries — most Butterworth implementations are simply plotted as trend lines, not used as the structural anchor of a volatility-adaptive stop mechanism.
Break down:
2-Pole Butterworth Super Smoother (Core Trend Line) (smoothed price)
The backbone of the indicator is a 2-Pole Butterworth Super Smoother, a concept brought into trading by engineer and author John Ehlers, first published in his 2004 book Cybernetic Analysis for Stocks and Futures
In this indicator: The Butterworth filter runs on
Parkinson Volatility (Sizes the Stop Distance)
"Developed by physicist Michael Parkinson in 1980, it estimates volatility using the natural logarithm of the high-to-low ratio each period, capturing intraday range rather than just close-to-close movement."
In this indicator: Parkinson Volatility is calculated over a rolling window (default 50 bars) and multiplied by
Butterworth Stop State Machine (The Main Line You Watch)
This is the primary plotted line, It's a classic ratcheting trailing stop built on top of outputs from steps 1 and 2.
In this indicator: The logic is a simple state machine with two modes — uptrend and downtrend. In an uptrend, the stop only moves up (never down), tracking at
Chande Momentum Oscillator + Deadband (Colors the BW Stop Line)
"The CMO measures momentum by calculating the difference between the sum of gains and the sum of losses over a specified period, dividing by their total to produce a normalized scale from -100 to +100 that accounts for both up and down days simultaneously."
In this indicator: CMO is calculated on
KAMA Midpoint (The Dynamic Midline and Fill Zone Anchor)
"Introduced by Perry Kaufman in 1995, KAMA dynamically adjusts its smoothing based on the relative efficiency of price movement".
In this indicator: Rather than applying KAMA to price directly, it's applied to the midpoint between the BW Stop and the Slow SuperTrend. This midpoint is a computed halfway value between the two lines. KAMA then smooths that midpoint adaptively, producing `kama_mid`. The fill colors you see on the chart are drawn between
Dual SuperTrend (Signals and Fill State Logic)
"Created by Olivier Seban, SuperTrend combines ATR-based volatility with trend detection into a single line that repositions dynamically as price confirms or breaks the current trend direction."
In this indicator: Two SuperTrend lines run simultaneously.
- The Slow ST (9× ATR) is the macro trend reference.
- The Fast ST (6× ATR) is never plotted at full size — it's compressed halfway toward the BW Stop and shown as orange circles
Pine Script®
Putting It All Together
The flow through the indicator is linear: Butterworth smooths price → Parkinson sizes the stop → the state machine builds the stop line → CMO colors it → KAMA anchors the midline fill → the dual SuperTrend fires signals and shades conviction.
END
Every component feeds the next, meaning the final signals and visuals are the product of five sequential filters rather than any single calculation — which is what gives the indicator its resistance to false signals in noisy market conditions.
版本注释
Changes made:- Removed the local `pi` variable in `f_super_smoother`, replaced with `math.pi` directly
- Removed intermediate `park_vol` variable, inlined into `stop_dist`
- Removed unused `st_hl2` alias for `hl2`
- Simplified `mid_raw` + redundant ternary away, replaced with `(st_slow + bw_stop) / 2.0` directly into `f_kama` call
- Same fix for `fast_shortened` → `fast_mid`, now `(st_fast + bw_stop) / 2.0`
- `fast_mid` extracted as a variable since it's referenced four times in the fills
版本注释
- HLC4 price source版本注释
- Added Percentile Bands group in inputs with lookback period (default 100), inner percentile level (default 68%), and show/hide toggle- Bands are built from `bw_deviation` — the rolling distance between `ha_close` and `bw_stop` — so the channel width reflects how far price historically strays from the filtered stop line
开源脚本
秉承TradingView的精神,该脚本的作者将其开源,以便交易者可以查看和验证其功能。向作者致敬!您可以免费使用该脚本,但请记住,重新发布代码须遵守我们的网站规则。

No courses, don't sell signals — just my own edge, stats public: jalgo.ca/
免责声明
这些信息和出版物并非旨在提供,也不构成TradingView提供或认可的任何形式的财务、投资、交易或其他类型的建议或推荐。请阅读使用条款了解更多信息。
开源脚本
秉承TradingView的精神,该脚本的作者将其开源,以便交易者可以查看和验证其功能。向作者致敬!您可以免费使用该脚本,但请记住,重新发布代码须遵守我们的网站规则。
免责声明
这些信息和出版物并非旨在提供,也不构成TradingView提供或认可的任何形式的财务、投资、交易或其他类型的建议或推荐。请阅读使用条款了解更多信息。