OPEN-SOURCE SCRIPT
Multi-Timeframe Support & Resistance Indicator
Description:
Trading Price Action is a strategy that depends basically in levels where the price movement is rejected and those levels are called Support and Resistance.
- Support level happens when the price level move below the current price and find a level to prevent a further downward move due buyers step in pushing the price back upward.
- Resistance level happens when the price move above the current price and find a level that prevents the price move further up due sellers step in pushing the price back downward.
Based on the main market trend those levels can be used to identify possible entries (preferably in the same direction of the main trend) or they can be used for Stoploss and Take profit levels.
So based on those concepts and my decision to trade only Price Action I decided to develop this indicator. On it I can see the main trend for the higher time frames like Monthly, Weekly and Daily.
That information is important to help me understand how the market is behaving on those timeframes widely used by trading companies and improve my chances to be on the right side of the trend.
When I am analyzing the charts I look for the below points:
• what is the the main trends?
• then I drop for my entry timeframe;
• check for a rejection from Support or Resistance(based on the main trend direction);
• set my entry: pending Limit or Stop or market
• set your Stoploss and Take profit levels
• and, more important, wait for a new bar open.
To identify the Stoploss I use the ATR. The Average True Range measure market volatility meaning how much the market moved in a period of time and it is widely used for professional traders.
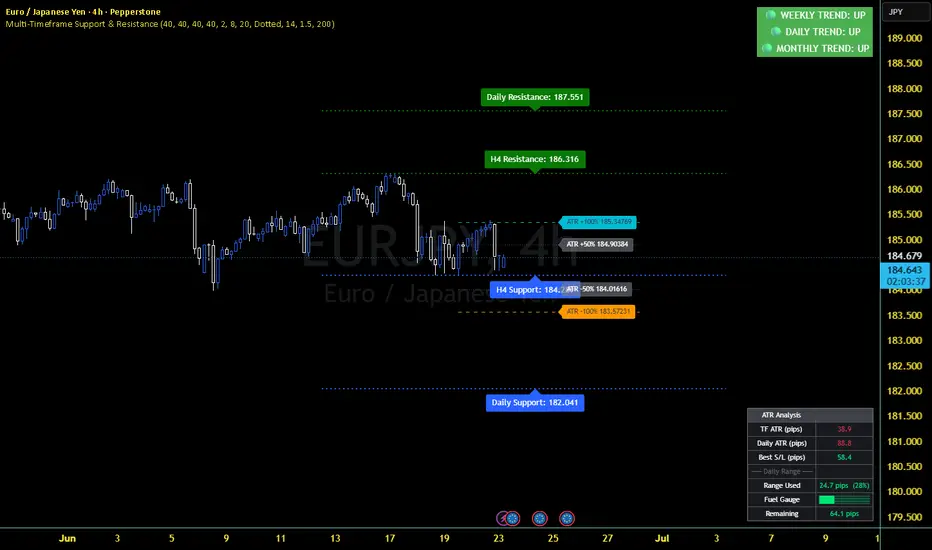
This indicator shows me the Daily ATR value as well as the current time frame ATR and to place my SL I use 1.5 * ATR(The current time frame ATR). With that I can avoid the SL chasers during the low volatility.
Also, based on the Daily ATR, I can see what was the total range (in pips and in %) and how many pips the price should move so I can have an idea the remaining pips I can get on a specific trade.
All those values are show in a table on my chart on the bottom right. There is a ”Fuel Gauge” for a more intuitive view about how many pips the price moved and how much “fuel” is still available.
I also added the ATR levels for not only place my SL but for a reference where price may be rejected. They are lines showing the % value for those levels and they work together with the Support and Resistance for Daily and H4. Those levels are some sort of “projections” based on the ATR.
The Main trend value for the 3 timeframes I check and they are located on the top right of my chart making easy to look so I know how the market may behave on my trading time frame(H4). One other thing on that feature is the colors. Uptrend is green and downtrend is red so if any one has a different color of the others I just move on and go to another pair.
Note that all those values and lines are customized and I have a full control to show or not them as well as change values if I think will improve my trade. This is a simple indicator that has been helping me trading Price Action.
Trading Price Action is a strategy that depends basically in levels where the price movement is rejected and those levels are called Support and Resistance.
- Support level happens when the price level move below the current price and find a level to prevent a further downward move due buyers step in pushing the price back upward.
- Resistance level happens when the price move above the current price and find a level that prevents the price move further up due sellers step in pushing the price back downward.
Based on the main market trend those levels can be used to identify possible entries (preferably in the same direction of the main trend) or they can be used for Stoploss and Take profit levels.
So based on those concepts and my decision to trade only Price Action I decided to develop this indicator. On it I can see the main trend for the higher time frames like Monthly, Weekly and Daily.
That information is important to help me understand how the market is behaving on those timeframes widely used by trading companies and improve my chances to be on the right side of the trend.
When I am analyzing the charts I look for the below points:
• what is the the main trends?
• then I drop for my entry timeframe;
• check for a rejection from Support or Resistance(based on the main trend direction);
• set my entry: pending Limit or Stop or market
• set your Stoploss and Take profit levels
• and, more important, wait for a new bar open.
To identify the Stoploss I use the ATR. The Average True Range measure market volatility meaning how much the market moved in a period of time and it is widely used for professional traders.
This indicator shows me the Daily ATR value as well as the current time frame ATR and to place my SL I use 1.5 * ATR(The current time frame ATR). With that I can avoid the SL chasers during the low volatility.
Also, based on the Daily ATR, I can see what was the total range (in pips and in %) and how many pips the price should move so I can have an idea the remaining pips I can get on a specific trade.
All those values are show in a table on my chart on the bottom right. There is a ”Fuel Gauge” for a more intuitive view about how many pips the price moved and how much “fuel” is still available.
I also added the ATR levels for not only place my SL but for a reference where price may be rejected. They are lines showing the % value for those levels and they work together with the Support and Resistance for Daily and H4. Those levels are some sort of “projections” based on the ATR.
The Main trend value for the 3 timeframes I check and they are located on the top right of my chart making easy to look so I know how the market may behave on my trading time frame(H4). One other thing on that feature is the colors. Uptrend is green and downtrend is red so if any one has a different color of the others I just move on and go to another pair.
Note that all those values and lines are customized and I have a full control to show or not them as well as change values if I think will improve my trade. This is a simple indicator that has been helping me trading Price Action.
开源脚本
秉承TradingView的精神,该脚本的作者将其开源,以便交易者可以查看和验证其功能。向作者致敬!您可以免费使用该脚本,但请记住,重新发布代码须遵守我们的网站规则。

免责声明
这些信息和出版物并非旨在提供,也不构成TradingView提供或认可的任何形式的财务、投资、交易或其他类型的建议或推荐。请阅读使用条款了解更多信息。
开源脚本
秉承TradingView的精神,该脚本的作者将其开源,以便交易者可以查看和验证其功能。向作者致敬!您可以免费使用该脚本,但请记住,重新发布代码须遵守我们的网站规则。
免责声明
这些信息和出版物并非旨在提供,也不构成TradingView提供或认可的任何形式的财务、投资、交易或其他类型的建议或推荐。请阅读使用条款了解更多信息。