OPEN-SOURCE SCRIPT
Stochastic with label OVS/OVB
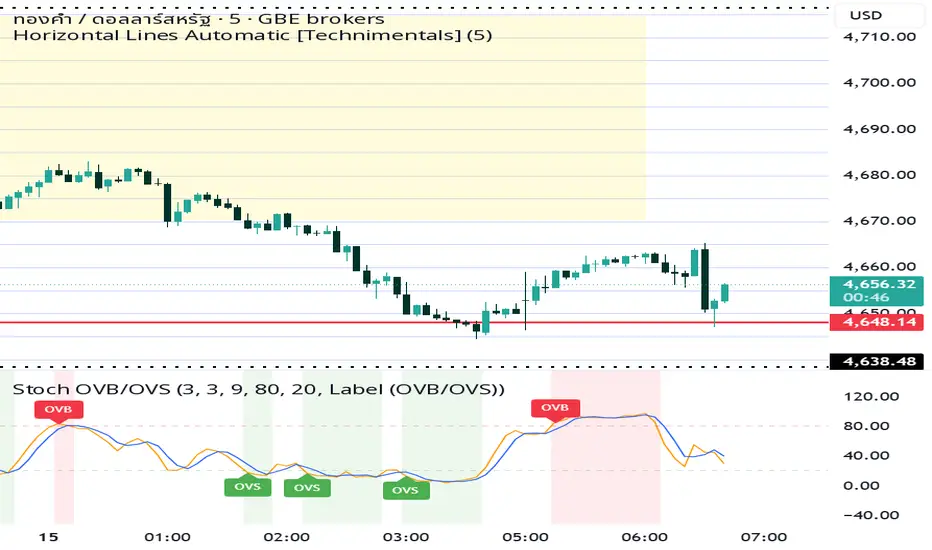
Stochastic Oscillator
A Stochastic Oscillator indicator with OVB (Overbought) and OVS (Oversold) signal labels displayed beneath the price chart. The indicator uses two momentum lines — a blue %K line and an orange %D signal line — fluctuating between the 20 and 80 levels to identify market momentum and potential reversal zones. Red “OVB” labels appear when the oscillator enters the overbought region above 80, signaling possible bearish exhaustion, while green “OVS” labels appear below 20, indicating potential bullish reversal opportunities. The indicator is designed to help traders detect momentum shifts, trend weakness, and short-term entry or exit signals in fast-moving markets such as XAU/USD.
A Stochastic Oscillator indicator with OVB (Overbought) and OVS (Oversold) signal labels displayed beneath the price chart. The indicator uses two momentum lines — a blue %K line and an orange %D signal line — fluctuating between the 20 and 80 levels to identify market momentum and potential reversal zones. Red “OVB” labels appear when the oscillator enters the overbought region above 80, signaling possible bearish exhaustion, while green “OVS” labels appear below 20, indicating potential bullish reversal opportunities. The indicator is designed to help traders detect momentum shifts, trend weakness, and short-term entry or exit signals in fast-moving markets such as XAU/USD.
开源脚本
秉承TradingView的精神,该脚本的作者将其开源,以便交易者可以查看和验证其功能。向作者致敬!您可以免费使用该脚本,但请记住,重新发布代码须遵守我们的网站规则。

免责声明
这些信息和出版物并非旨在提供,也不构成TradingView提供或认可的任何形式的财务、投资、交易或其他类型的建议或推荐。请阅读使用条款了解更多信息。
免责声明
这些信息和出版物并非旨在提供,也不构成TradingView提供或认可的任何形式的财务、投资、交易或其他类型的建议或推荐。请阅读使用条款了解更多信息。