Strong SFP MSS | ProjectSyndicate
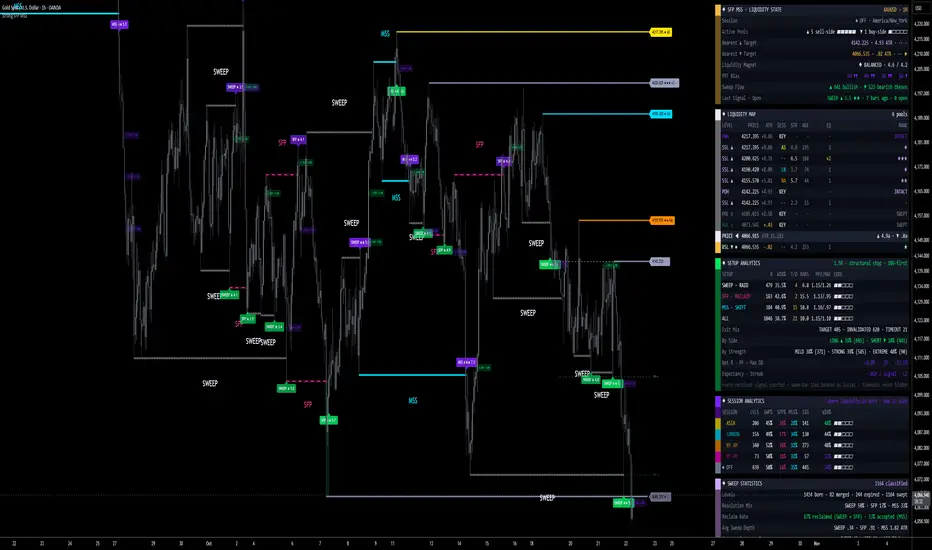
▪️Strong SFP MSS maps where the stops are resting, then tells you what happened the moment price goes and takes them. Every swing high and swing low is a pool of resting liquidity — buy stops above the highs, sell stops below the lows — and markets move from one pool to the next. The question that decides the trade is never whether price reaches a pool. It is what price does in the seconds after it gets there: raid it and snap straight back, close through and then fail, or close through and hold.
▪️That resolution is the event. The engine tracks every unswept pool as a live level, tags it with the session that created it, scores it 0–10 for quality, and the instant price interacts with it classifies the outcome into one of three states — SWEEP, SFP or MSS — each with its own directional thesis. Every classification gets a 0–10 strength with a 1–4 star rank, a structural invalidation level anchored to the sweep itself, a fixed R target, and is tracked live on a five-panel dashboard that counts every resolved signal including the losses and the timeouts — so you can see exactly how liquidity behaves on the symbol and timeframe you actually trade.
🧠 Liquidity Core — the core idea, expressed as a lifecycle: POOL ▸ APPROACH ▸ RAID ▸ RESOLVE ▸ THESIS. A confirmed swing pivot that price has not yet traded through becomes a liquidity pool and is drawn forward as a live target. Sell-side liquidity sits above the highs, buy-side liquidity sits below the lows. The pool waits. When price finally reaches it, the engine reads the bar's close against the level and resolves the pool into exactly one of three outcomes, then retires it — one event per level, no double counting, no level left hanging in an ambiguous state.
🔎 Three Resolutions — SWEEP, SFP, MSS. SWEEP is a liquidity raid: the wick trades clean through the pool and the same candle closes back on the original side. Stops are taken, nothing is accepted, and the thesis is reversal — away from the pool that was just raided. SFP is a swing-failure: price closes through the level, holds there for a bar or more, and then closes back inside. The breakout failed and the thesis is reversal, with the deeper excursion behind it. MSS is a market-structure shift: price closes through and is accepted beyond, confirmed either by a continuation close, by an optional displacement filter measured in ATR, or by the Pierce Patience rule when price simply refuses to come back. The thesis is continuation, in the direction of the break. This is the distinction most tools collapse into a single "sweep" marker — and it is the one that decides whether you fade the move or follow it.
🏷️ Pools With Memory — a liquidity level is not just a horizontal line. Every pool carries the session that created it, colour-coded on the chart and tracked separately in the statistics: Asia, London, NY AM, NY PM, or outside session, with your own timezone and session windows. Equal highs and equal lows are merged into a single pool rather than stacked as duplicate lines — a new pivot within an ATR tolerance of an existing level is absorbed into it, the touch count increments, the pool re-anchors to the most extreme print, and the strength score rises. An equal-high pool with three touches is visibly and numerically heavier than a lone pivot, because that is where the stops are stacked.
🗝️ Key Liquidity — on top of the pivot pools, the engine draws the four levels every desk watches: prior day high, prior day low, prior week high, prior week low. All four are read from the last closed day and the last closed week using the non-repainting higher-timeframe pattern, drawn as neon dashed targets, and dimmed automatically the moment the current period sweeps them — so you always know at a glance whether PDH is still a live magnet or already taken.
🔋 Strength Anatomy — a sweep is not just true or false; it is scored for how clean the setup is. Two scores work together. Level Strength (0–10) grades the pool before anything happens to it, fusing session weight (NY AM carries more than a quiet overnight print), equal-level touches (stacked stops), pivot volume against its own 20-bar average, and the rejection wick on the pivot bar itself. Signal Strength (0–10) then grades the resolution, fusing that level quality with the sweep depth in ATR (how violently the pool was raided), the volume surge on the resolution bar, and the decisiveness of the reclaim or the displacement body. The result is a single number that separates a textbook SFP off a triple-touched London high from a lazy wick through a stale pivot.
🎯 Structural Invalidation + R-Based Targets — the stop is anchored to the sweep, not guessed. In Structural mode, the default, invalidation for a SWEEP or an SFP sits beyond the extreme of the raid itself — the price that, if exceeded, means the reclaim failed and the liquidity run is still going — plus an ATR buffer for cushion. For an MSS, invalidation sits back through the level that was just broken, because a true structure shift should not hand the level back. ATR mode is available for a fixed-distance stop instead. Either way the risk is floored at a minimum ATR distance so a tight reclaim never produces a scalp-sized stop that noise alone would clip.
▪️The target runs as a clean R multiple of that measured risk, defaulting to 1.5R, and every tracked signal plots its target and invalidation as live rails that extend with the trade until it resolves. The exit prints a labelled result — ✓ TGT, ✕ INV or ◦ END — carrying the signed R, the bars held, and the MFE and MAE of the trade, so you can see not only whether it worked but how much heat it took and how much it left on the table.
⭐ 0–10 Strength with Star Tiers — every classification is labelled with its numeric strength and a 1–4 star rank, and is bucketed into MILD, STRONG or EXTREME for the statistics. Treat the strength as a cleanliness and confluence read for ranking and thinning setups — it describes how textbook a liquidity event is, not a guaranteed outcome. The Minimum Signal Strength gate decides which classifications graduate into tracked signals with rails, outcome labels and alerts, while the dashboard keeps breaking results out by tier in the background so you can see, on your own data, whether the higher tiers actually convert better on your market.
🎚️ Conviction Controls — a compact set of dials sets how much structure a level needs before it counts and how strict a resolution must be: the Pivot Period that defines what a swing is at all, the Max Active Levels per side, the optional Max Level Age, the equal-level merge tolerance in ATR, the MSS Displacement Filter that forces a break to travel a minimum ATR distance before it is accepted, the Pierce Patience window that converts a stubborn unreclaimed break into an MSS, the Minimum Signal Strength floor, the proximity window that defines "approaching", and the stop model with its buffer, ATR distance and minimum-risk floor. Each of the three setups can be switched off independently — trade only reclaims, only shifts, or all three. Tighten for fewer, heavier liquidity events; loosen for more activity. This is your main control over conviction versus frequency.
🧭 Honest Accounting — this is the part most published indicators quietly get wrong. Resolution is invalidation-first and pessimistic: a bar that touches both the target and the invalidation is always booked as the loss. Resolution begins on the bar after the signal, never on the signal bar itself. A signal that reaches neither level inside the Max Hold window is closed as a TIMEOUT, marked to market at the close and counted as a non-win rather than quietly dropped. Nothing is excluded from the statistics for being ugly — no losers hidden, no quick stop-outs filtered out, no outcome-based deletion of signals from the chart. The visual history cap only recycles old drawings; the counters stay cumulative over the entire chart history. And because the win rate is meaningless without the payoff, the dashboard colours it against the real breakeven for your chosen R — at the default 1.5R target that line is 40%, and the panel tells you which side of it you are on.
📊 Five-Panel Dashboard — a stacked neon panel tracks, in real time on your chart:
▪️I · LIQUIDITY STATE — the live session, active pool counts per side with fill gauges, the nearest sell-side and buy-side targets with their exact distance in ATR, a Liquidity Magnet read comparing the average pool strength above versus below price, a multi-timeframe bias strip reading your chart timeframe plus the next three higher ones from their last closed bars, the running count of bullish versus bearish sweep theses, and the last signal with its star score plus how many signals are still open.
▪️II · LIQUIDITY MAP — every tracked level sorted top to bottom with a PRICE row slotted into its true position, so you read the book exactly as price sees it. Each row carries the level price, the signed distance in ATR with proximity highlighting, the origin session, the 0–10 strength, the age in bars, the equal-level touch count, and the star rank — with pivot pools, PDH/PDL, PWH/PWL and pierced levels all flagged distinctly.
▪️III · SETUP ANALYTICS — SWEEP, SFP, MSS and ALL broken out side by side: sample count, win rate coloured against the breakeven for your R, timeout count, average bars to target, average MFE and MAE in R, and an edge gauge. Below it the full exit mix, performance by side, performance by strength tier, net R, profit factor, max drawdown in R, expectancy per signal and the current streak.
▪️IV · SESSION ANALYTICS — where liquidity is born and how it dies. Levels created per session, the percentage of those levels that resolved as SWEEP, SFP and MSS, and the signal count and win rate for signals fired during each session. This is how you find out that your market reclaims London highs but accepts breaks of NY AM highs, on your own data.
▪️V · SWEEP STATISTICS — levels born, merged, expired unswept and swept; the overall resolution mix; the Reclaim Rate that tells you in one number whether your market fakes through liquidity or trends through it; average sweep depth and average level age at resolution per setup; and a Calibration line that reads your own numbers and tells you when the Pivot Period or the active-level cap needs adjusting.
🎨 Neon Visuals — three neon palettes plus a fully custom pair, all built for a black chart background. Active pools are drawn in their session colour with an optional glow layer and a price tag carrying the level, its stars, its touch count and its session. On resolution the line recolours and restyles to its setup identity — SWEEP, SFP and MSS each with their own colour and line style — the event prints a large label at the midpoint of the level's life, and a sweep box shades the exact excursion beyond the pool. Signal tags carry the setup, the stars and the score, with automatic text-contrast so labels stay readable on every background shade, and every hover tooltip carries the full breakdown: thesis, level origin, sweep depth, level age, volume ratio and session.
🔔 Detailed Alerts — eighteen conditions, all formatted for manual or automated use: new sell-side and new buy-side liquidity confirmed; SWEEP, SFP and MSS each split bullish and bearish; any tracked signal and a separate EXTREME-only signal alert; target hit and invalidated; price entering the proximity window of sell-side or buy-side liquidity; and dedicated alerts for prior day high, prior day low, prior week high and prior week low being swept.
🔧 Fully Customizable — every component is exposed: pivot period, active-level cap, max level age, equal-level merging and its ATR tolerance, ATR length; the timezone and all four session windows with their colours; the four key-liquidity lines and their length; each of the three setups independently, the MSS displacement filter, the pierce patience window and the proximity threshold; the minimum strength gate, the stop model with its buffer, minimum risk and ATR distance, the R target, the max-hold window, and the outcome and rail toggles; the palette, the per-setup colours and line styles, line width, glow, extension, event text size, ATR-scaled text distance and flip, price tags, signal tags, sweep boxes and the history cap; and the dashboard position, size, transparency, separator gap, monospace numerals and every one of the five panel toggles.
🎯 Why this is different — most liquidity tools draw a line at a swing high and print one generic marker when price touches it. This one treats the pool as a tracked object with a session, a touch count and a quality score, resolves every interaction into one of three mechanically distinct outcomes with opposite trade implications, anchors invalidation to the structure of the raid itself rather than a flat multiple, and then does the thing almost no published indicator does: it tells you the truth about what happened next. Five panels of live statistics on your symbol, your timeframe and your sessions — resolution mix, reclaim rate, per-setup win rates against the real breakeven, per-session behaviour, MFE and MAE, timeouts counted in full. You judge the logic on current data from your own chart instead of a number printed in a description.
🚀 Where to use it — the engine was built and reviewed on XAUUSD on intraday timeframes, where session liquidity runs are a constant feature, but the mechanics are symbol-agnostic and rest on universal behaviour: every market leaves stops above its highs and below its lows, and every market eventually goes to get them. It applies to FX majors and crosses, metals, indices and crypto across intraday and higher timeframes, with ATR scaling on every distance so pools, sweeps, stops and targets adapt to each instrument's volatility. It is at its most useful around session opens, at prior-day and prior-week extremes, and into obvious equal highs and equal lows, and it demands more care in thin, gapping conditions where a pool can be jumped rather than raided. The Reclaim Rate in Panel V is the fastest honest answer to whether your market is a fader's market or a breakout market.
🎯 How to trade it
▪️Apply it to a liquid symbol, set your timezone and session windows, and let the dashboard populate. Read Panel V's Reclaim Rate and Panel III's per-setup win rates for your symbol and timeframe first — if liquidity on that market does not behave the way the logic assumes, you will see it immediately.
▪️Watch the Liquidity Map and the Nearest Target rows while price travels. The ATR distance column and the proximity highlight show a pool being approached before anything resolves, so a setup builds in front of you instead of ambushing you.
▪️Wait for a labelled resolution on a closed bar — SWEEP, SFP or MSS — with its stars and score. SWEEP and SFP are reversal theses away from the pool; MSS is a continuation thesis through it. The target and invalidation rails are already plotted.
▪️Read the star tier together with the pool's own strength and touch count. A deep raid of a triple-touched NY AM high, reclaimed on heavy volume, is a different proposition from a shallow wick through a stale overnight pivot — and the number says so before you commit.
▪️Manage the trade with the plotted rails. The structural invalidation sits beyond the raid extreme on reversals and back through the level on shifts, and the target sits at your chosen R. Bank or trail however suits your style.
▪️Use the Minimum Signal Strength floor, the MSS Displacement Filter, the Pierce Patience window and the Pivot Period to set your tempo — stricter for fewer, heavier liquidity events; looser for more activity. Check Panel III's By Strength row after a few hundred signals to see whether your gate is actually earning its keep.
⚠️ Important — this is a decision-support tool, not a standalone buy/sell system, and it makes no performance guarantees. Default settings were chosen on historical gold data and behaviour will vary by symbol, timeframe, session and configuration; the dashboard's statistics are historical and descriptive, not a forecast, and are simulated without spread, commission or slippage. The trade model resolves invalidation-first and books timeouts as non-wins, which is honest but means the win rate alone is misleading — always read it next to the breakeven line for your chosen R, the average R, and the profit factor. Levels confirm only after the pivot period has elapsed and classifications fire on closed bars, so always wait for the labelled event on a closed candle rather than anticipating it intrabar. Liquidity can be swept far deeper than any structural stop allows before a reclaim finally comes, and a market-structure shift can fail and reverse immediately — combine it with your own analysis and risk management, and test it on your market before trading it live.
▪️That resolution is the event. The engine tracks every unswept pool as a live level, tags it with the session that created it, scores it 0–10 for quality, and the instant price interacts with it classifies the outcome into one of three states — SWEEP, SFP or MSS — each with its own directional thesis. Every classification gets a 0–10 strength with a 1–4 star rank, a structural invalidation level anchored to the sweep itself, a fixed R target, and is tracked live on a five-panel dashboard that counts every resolved signal including the losses and the timeouts — so you can see exactly how liquidity behaves on the symbol and timeframe you actually trade.
🧠 Liquidity Core — the core idea, expressed as a lifecycle: POOL ▸ APPROACH ▸ RAID ▸ RESOLVE ▸ THESIS. A confirmed swing pivot that price has not yet traded through becomes a liquidity pool and is drawn forward as a live target. Sell-side liquidity sits above the highs, buy-side liquidity sits below the lows. The pool waits. When price finally reaches it, the engine reads the bar's close against the level and resolves the pool into exactly one of three outcomes, then retires it — one event per level, no double counting, no level left hanging in an ambiguous state.
🔎 Three Resolutions — SWEEP, SFP, MSS. SWEEP is a liquidity raid: the wick trades clean through the pool and the same candle closes back on the original side. Stops are taken, nothing is accepted, and the thesis is reversal — away from the pool that was just raided. SFP is a swing-failure: price closes through the level, holds there for a bar or more, and then closes back inside. The breakout failed and the thesis is reversal, with the deeper excursion behind it. MSS is a market-structure shift: price closes through and is accepted beyond, confirmed either by a continuation close, by an optional displacement filter measured in ATR, or by the Pierce Patience rule when price simply refuses to come back. The thesis is continuation, in the direction of the break. This is the distinction most tools collapse into a single "sweep" marker — and it is the one that decides whether you fade the move or follow it.
🏷️ Pools With Memory — a liquidity level is not just a horizontal line. Every pool carries the session that created it, colour-coded on the chart and tracked separately in the statistics: Asia, London, NY AM, NY PM, or outside session, with your own timezone and session windows. Equal highs and equal lows are merged into a single pool rather than stacked as duplicate lines — a new pivot within an ATR tolerance of an existing level is absorbed into it, the touch count increments, the pool re-anchors to the most extreme print, and the strength score rises. An equal-high pool with three touches is visibly and numerically heavier than a lone pivot, because that is where the stops are stacked.
🗝️ Key Liquidity — on top of the pivot pools, the engine draws the four levels every desk watches: prior day high, prior day low, prior week high, prior week low. All four are read from the last closed day and the last closed week using the non-repainting higher-timeframe pattern, drawn as neon dashed targets, and dimmed automatically the moment the current period sweeps them — so you always know at a glance whether PDH is still a live magnet or already taken.
🔋 Strength Anatomy — a sweep is not just true or false; it is scored for how clean the setup is. Two scores work together. Level Strength (0–10) grades the pool before anything happens to it, fusing session weight (NY AM carries more than a quiet overnight print), equal-level touches (stacked stops), pivot volume against its own 20-bar average, and the rejection wick on the pivot bar itself. Signal Strength (0–10) then grades the resolution, fusing that level quality with the sweep depth in ATR (how violently the pool was raided), the volume surge on the resolution bar, and the decisiveness of the reclaim or the displacement body. The result is a single number that separates a textbook SFP off a triple-touched London high from a lazy wick through a stale pivot.
🎯 Structural Invalidation + R-Based Targets — the stop is anchored to the sweep, not guessed. In Structural mode, the default, invalidation for a SWEEP or an SFP sits beyond the extreme of the raid itself — the price that, if exceeded, means the reclaim failed and the liquidity run is still going — plus an ATR buffer for cushion. For an MSS, invalidation sits back through the level that was just broken, because a true structure shift should not hand the level back. ATR mode is available for a fixed-distance stop instead. Either way the risk is floored at a minimum ATR distance so a tight reclaim never produces a scalp-sized stop that noise alone would clip.
▪️The target runs as a clean R multiple of that measured risk, defaulting to 1.5R, and every tracked signal plots its target and invalidation as live rails that extend with the trade until it resolves. The exit prints a labelled result — ✓ TGT, ✕ INV or ◦ END — carrying the signed R, the bars held, and the MFE and MAE of the trade, so you can see not only whether it worked but how much heat it took and how much it left on the table.
⭐ 0–10 Strength with Star Tiers — every classification is labelled with its numeric strength and a 1–4 star rank, and is bucketed into MILD, STRONG or EXTREME for the statistics. Treat the strength as a cleanliness and confluence read for ranking and thinning setups — it describes how textbook a liquidity event is, not a guaranteed outcome. The Minimum Signal Strength gate decides which classifications graduate into tracked signals with rails, outcome labels and alerts, while the dashboard keeps breaking results out by tier in the background so you can see, on your own data, whether the higher tiers actually convert better on your market.
🎚️ Conviction Controls — a compact set of dials sets how much structure a level needs before it counts and how strict a resolution must be: the Pivot Period that defines what a swing is at all, the Max Active Levels per side, the optional Max Level Age, the equal-level merge tolerance in ATR, the MSS Displacement Filter that forces a break to travel a minimum ATR distance before it is accepted, the Pierce Patience window that converts a stubborn unreclaimed break into an MSS, the Minimum Signal Strength floor, the proximity window that defines "approaching", and the stop model with its buffer, ATR distance and minimum-risk floor. Each of the three setups can be switched off independently — trade only reclaims, only shifts, or all three. Tighten for fewer, heavier liquidity events; loosen for more activity. This is your main control over conviction versus frequency.
🧭 Honest Accounting — this is the part most published indicators quietly get wrong. Resolution is invalidation-first and pessimistic: a bar that touches both the target and the invalidation is always booked as the loss. Resolution begins on the bar after the signal, never on the signal bar itself. A signal that reaches neither level inside the Max Hold window is closed as a TIMEOUT, marked to market at the close and counted as a non-win rather than quietly dropped. Nothing is excluded from the statistics for being ugly — no losers hidden, no quick stop-outs filtered out, no outcome-based deletion of signals from the chart. The visual history cap only recycles old drawings; the counters stay cumulative over the entire chart history. And because the win rate is meaningless without the payoff, the dashboard colours it against the real breakeven for your chosen R — at the default 1.5R target that line is 40%, and the panel tells you which side of it you are on.
📊 Five-Panel Dashboard — a stacked neon panel tracks, in real time on your chart:
▪️I · LIQUIDITY STATE — the live session, active pool counts per side with fill gauges, the nearest sell-side and buy-side targets with their exact distance in ATR, a Liquidity Magnet read comparing the average pool strength above versus below price, a multi-timeframe bias strip reading your chart timeframe plus the next three higher ones from their last closed bars, the running count of bullish versus bearish sweep theses, and the last signal with its star score plus how many signals are still open.
▪️II · LIQUIDITY MAP — every tracked level sorted top to bottom with a PRICE row slotted into its true position, so you read the book exactly as price sees it. Each row carries the level price, the signed distance in ATR with proximity highlighting, the origin session, the 0–10 strength, the age in bars, the equal-level touch count, and the star rank — with pivot pools, PDH/PDL, PWH/PWL and pierced levels all flagged distinctly.
▪️III · SETUP ANALYTICS — SWEEP, SFP, MSS and ALL broken out side by side: sample count, win rate coloured against the breakeven for your R, timeout count, average bars to target, average MFE and MAE in R, and an edge gauge. Below it the full exit mix, performance by side, performance by strength tier, net R, profit factor, max drawdown in R, expectancy per signal and the current streak.
▪️IV · SESSION ANALYTICS — where liquidity is born and how it dies. Levels created per session, the percentage of those levels that resolved as SWEEP, SFP and MSS, and the signal count and win rate for signals fired during each session. This is how you find out that your market reclaims London highs but accepts breaks of NY AM highs, on your own data.
▪️V · SWEEP STATISTICS — levels born, merged, expired unswept and swept; the overall resolution mix; the Reclaim Rate that tells you in one number whether your market fakes through liquidity or trends through it; average sweep depth and average level age at resolution per setup; and a Calibration line that reads your own numbers and tells you when the Pivot Period or the active-level cap needs adjusting.
🎨 Neon Visuals — three neon palettes plus a fully custom pair, all built for a black chart background. Active pools are drawn in their session colour with an optional glow layer and a price tag carrying the level, its stars, its touch count and its session. On resolution the line recolours and restyles to its setup identity — SWEEP, SFP and MSS each with their own colour and line style — the event prints a large label at the midpoint of the level's life, and a sweep box shades the exact excursion beyond the pool. Signal tags carry the setup, the stars and the score, with automatic text-contrast so labels stay readable on every background shade, and every hover tooltip carries the full breakdown: thesis, level origin, sweep depth, level age, volume ratio and session.
🔔 Detailed Alerts — eighteen conditions, all formatted for manual or automated use: new sell-side and new buy-side liquidity confirmed; SWEEP, SFP and MSS each split bullish and bearish; any tracked signal and a separate EXTREME-only signal alert; target hit and invalidated; price entering the proximity window of sell-side or buy-side liquidity; and dedicated alerts for prior day high, prior day low, prior week high and prior week low being swept.
🔧 Fully Customizable — every component is exposed: pivot period, active-level cap, max level age, equal-level merging and its ATR tolerance, ATR length; the timezone and all four session windows with their colours; the four key-liquidity lines and their length; each of the three setups independently, the MSS displacement filter, the pierce patience window and the proximity threshold; the minimum strength gate, the stop model with its buffer, minimum risk and ATR distance, the R target, the max-hold window, and the outcome and rail toggles; the palette, the per-setup colours and line styles, line width, glow, extension, event text size, ATR-scaled text distance and flip, price tags, signal tags, sweep boxes and the history cap; and the dashboard position, size, transparency, separator gap, monospace numerals and every one of the five panel toggles.
🎯 Why this is different — most liquidity tools draw a line at a swing high and print one generic marker when price touches it. This one treats the pool as a tracked object with a session, a touch count and a quality score, resolves every interaction into one of three mechanically distinct outcomes with opposite trade implications, anchors invalidation to the structure of the raid itself rather than a flat multiple, and then does the thing almost no published indicator does: it tells you the truth about what happened next. Five panels of live statistics on your symbol, your timeframe and your sessions — resolution mix, reclaim rate, per-setup win rates against the real breakeven, per-session behaviour, MFE and MAE, timeouts counted in full. You judge the logic on current data from your own chart instead of a number printed in a description.
🚀 Where to use it — the engine was built and reviewed on XAUUSD on intraday timeframes, where session liquidity runs are a constant feature, but the mechanics are symbol-agnostic and rest on universal behaviour: every market leaves stops above its highs and below its lows, and every market eventually goes to get them. It applies to FX majors and crosses, metals, indices and crypto across intraday and higher timeframes, with ATR scaling on every distance so pools, sweeps, stops and targets adapt to each instrument's volatility. It is at its most useful around session opens, at prior-day and prior-week extremes, and into obvious equal highs and equal lows, and it demands more care in thin, gapping conditions where a pool can be jumped rather than raided. The Reclaim Rate in Panel V is the fastest honest answer to whether your market is a fader's market or a breakout market.
🎯 How to trade it
▪️Apply it to a liquid symbol, set your timezone and session windows, and let the dashboard populate. Read Panel V's Reclaim Rate and Panel III's per-setup win rates for your symbol and timeframe first — if liquidity on that market does not behave the way the logic assumes, you will see it immediately.
▪️Watch the Liquidity Map and the Nearest Target rows while price travels. The ATR distance column and the proximity highlight show a pool being approached before anything resolves, so a setup builds in front of you instead of ambushing you.
▪️Wait for a labelled resolution on a closed bar — SWEEP, SFP or MSS — with its stars and score. SWEEP and SFP are reversal theses away from the pool; MSS is a continuation thesis through it. The target and invalidation rails are already plotted.
▪️Read the star tier together with the pool's own strength and touch count. A deep raid of a triple-touched NY AM high, reclaimed on heavy volume, is a different proposition from a shallow wick through a stale overnight pivot — and the number says so before you commit.
▪️Manage the trade with the plotted rails. The structural invalidation sits beyond the raid extreme on reversals and back through the level on shifts, and the target sits at your chosen R. Bank or trail however suits your style.
▪️Use the Minimum Signal Strength floor, the MSS Displacement Filter, the Pierce Patience window and the Pivot Period to set your tempo — stricter for fewer, heavier liquidity events; looser for more activity. Check Panel III's By Strength row after a few hundred signals to see whether your gate is actually earning its keep.
⚠️ Important — this is a decision-support tool, not a standalone buy/sell system, and it makes no performance guarantees. Default settings were chosen on historical gold data and behaviour will vary by symbol, timeframe, session and configuration; the dashboard's statistics are historical and descriptive, not a forecast, and are simulated without spread, commission or slippage. The trade model resolves invalidation-first and books timeouts as non-wins, which is honest but means the win rate alone is misleading — always read it next to the breakeven line for your chosen R, the average R, and the profit factor. Levels confirm only after the pivot period has elapsed and classifications fire on closed bars, so always wait for the labelled event on a closed candle rather than anticipating it intrabar. Liquidity can be swept far deeper than any structural stop allows before a reclaim finally comes, and a market-structure shift can fail and reverse immediately — combine it with your own analysis and risk management, and test it on your market before trading it live.

Gold Algo Trading · +1100% YTD · max DD <5%
Syndicate Ultimate · 5 algo systems · 1 bundle
1 payment · lifetime access · no monthly fees
+ FX · NQ/ES · 10+ yr institutional desk
syndicate001.com
Join on Telegram
t.me/aisyndicate001
Syndicate Ultimate · 5 algo systems · 1 bundle
1 payment · lifetime access · no monthly fees
+ FX · NQ/ES · 10+ yr institutional desk
syndicate001.com
Join on Telegram
t.me/aisyndicate001
免责声明
这些信息和出版物并非旨在提供,也不构成TradingView提供或认可的任何形式的财务、投资、交易或其他类型的建议或推荐。请阅读使用条款了解更多信息。
Gold Algo Trading · +1100% YTD · max DD <5%
Syndicate Ultimate · 5 algo systems · 1 bundle
1 payment · lifetime access · no monthly fees
+ FX · NQ/ES · 10+ yr institutional desk
syndicate001.com
Join on Telegram
t.me/aisyndicate001
Syndicate Ultimate · 5 algo systems · 1 bundle
1 payment · lifetime access · no monthly fees
+ FX · NQ/ES · 10+ yr institutional desk
syndicate001.com
Join on Telegram
t.me/aisyndicate001
免责声明
这些信息和出版物并非旨在提供,也不构成TradingView提供或认可的任何形式的财务、投资、交易或其他类型的建议或推荐。请阅读使用条款了解更多信息。