已更新
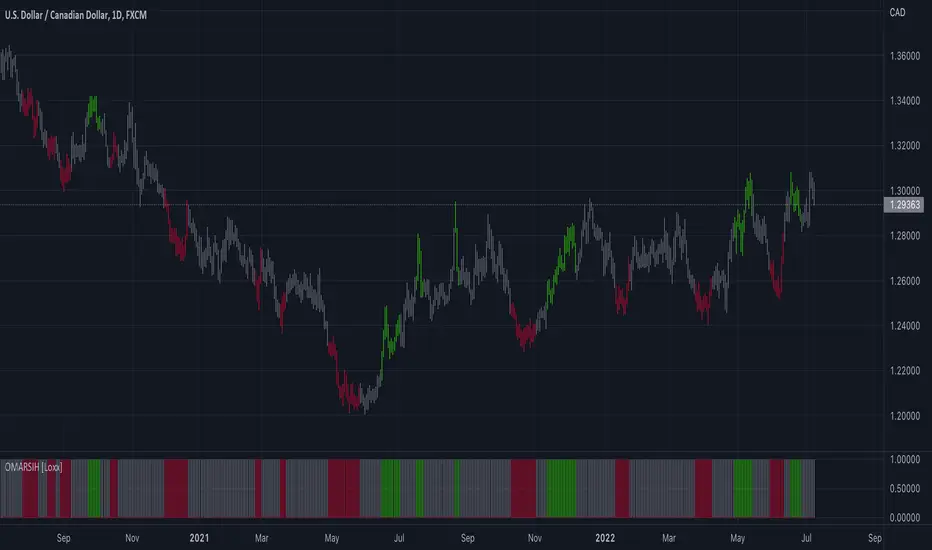
OMA (One More Average) RSI Histogram [Loxx]
More exclusive indicators from loxx
Subscribe to Algx Trading for $120.00/month to get exclusive indicators by this author. You pay right on TradingView and can use them on your charts straight away.
Explore Algx TradingOMA (One More Average) RSI Histogram [Loxx] is an RSI histogram built using the OMA adaptive moving average. This is meant to filter out the noise from regular RSI. You'll notice that it rarely signals, but the signals that do show up are perfectly set up for mean reversion/trend ATR-based trading.
What is the One More Moving Average (OMA)?
The usual story goes something like this : which is the best moving average? Everyone that ever started to do any kind of technical analysis was pulled into this "game". Comparing, testing, looking for new ones, testing ...
The idea of this one is simple: it should not be itself, but it should be a kind of a chameleon - it should "imitate" as much other moving averages as it can. So the need for zillion different moving averages would diminish. And it should have some extra, of course:
How to use
Included
What is the One More Moving Average (OMA)?
The usual story goes something like this : which is the best moving average? Everyone that ever started to do any kind of technical analysis was pulled into this "game". Comparing, testing, looking for new ones, testing ...
The idea of this one is simple: it should not be itself, but it should be a kind of a chameleon - it should "imitate" as much other moving averages as it can. So the need for zillion different moving averages would diminish. And it should have some extra, of course:
How to use
- Green means buy
- Red means sell
Included
- Bar coloring
版本注释
Updated to MTF
免责声明
这些信息和出版物并非旨在提供,也不构成TradingView提供或认可的任何形式的财务、投资、交易或其他类型的建议或推荐。请阅读使用条款了解更多信息。