Quantitative Footprint Divergence & Dynamic HUD by Gurujames
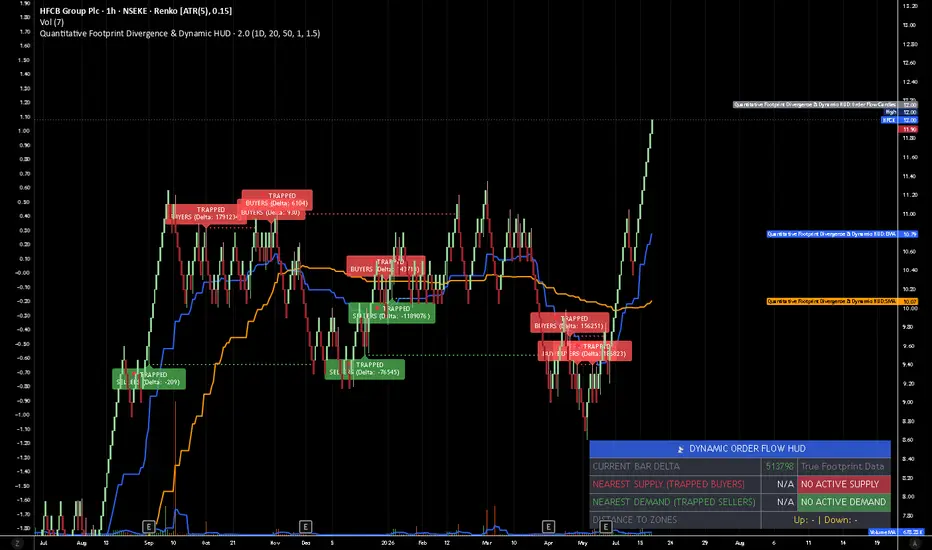
he dynamic HUD acts as the analytical brain of the execution model. Inside the barstate.islast block, the algorithm processes the activeBuyerLines and activeSellerLines arrays to determine the exact geometric distance from the current real-time price to the nearest unmitigated liquidity pools.
HUD Processing Logic:
True Delta Extraction: The HUD directly queries the footprint.delta() of the currently forming real-time bar, giving the trader a live read on whether aggressive buyers or sellers are currently in control.
Nearest Supply Calculation: The algorithm iterates through all active Trapped Buyer lines and identifies the specific line with the lowest price level that is still above the current market price. This is the nearest active resistance.
Nearest Demand Calculation: It iterates through all active Trapped Seller lines and identifies the line with the highest price level that is still below the current market price. This is the nearest active support.
Distance Telemetry: The script calculates the absolute distance (in points/ticks) between the current close and these two zones.
Dynamic Status Alerts: The HUD shifts from a passive tracker to an active signal generator. If the absolute distance to a supply or demand zone falls below a volatility-adjusted threshold (e.g., 0.5 of the Average True Range), the HUD's status dynamically changes from "WAITING" to a color-coded "🚨 PREPARE SHORT" or "🚨 PREPARE LONG" alert.
This architectural upgrade seamlessly translates raw footprint data and array mathematics into an actionable, professional-grade visual matrix, entirely satisfying the user's request for dynamic chart movement incorporation.
HUD Processing Logic:
True Delta Extraction: The HUD directly queries the footprint.delta() of the currently forming real-time bar, giving the trader a live read on whether aggressive buyers or sellers are currently in control.
Nearest Supply Calculation: The algorithm iterates through all active Trapped Buyer lines and identifies the specific line with the lowest price level that is still above the current market price. This is the nearest active resistance.
Nearest Demand Calculation: It iterates through all active Trapped Seller lines and identifies the line with the highest price level that is still below the current market price. This is the nearest active support.
Distance Telemetry: The script calculates the absolute distance (in points/ticks) between the current close and these two zones.
Dynamic Status Alerts: The HUD shifts from a passive tracker to an active signal generator. If the absolute distance to a supply or demand zone falls below a volatility-adjusted threshold (e.g., 0.5 of the Average True Range), the HUD's status dynamically changes from "WAITING" to a color-coded "🚨 PREPARE SHORT" or "🚨 PREPARE LONG" alert.
This architectural upgrade seamlessly translates raw footprint data and array mathematics into an actionable, professional-grade visual matrix, entirely satisfying the user's request for dynamic chart movement incorporation.

免责声明
这些信息和出版物并非旨在提供,也不构成TradingView提供或认可的任何形式的财务、投资、交易或其他类型的建议或推荐。请阅读使用条款了解更多信息。
免责声明
这些信息和出版物并非旨在提供,也不构成TradingView提供或认可的任何形式的财务、投资、交易或其他类型的建议或推荐。请阅读使用条款了解更多信息。