已更新
ETF Rotation - Momentum / Volatility
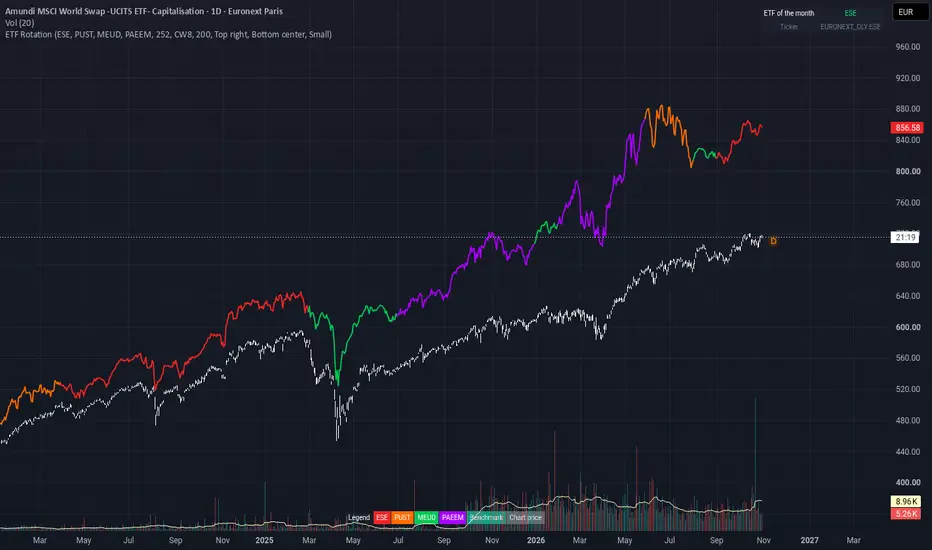
ETF Rotation – Momentum / Volatility (PEA-friendly)
A simple monthly rotation between a small universe of ETFs. Each month, the indicator picks the ETF with the best risk-adjusted momentum and shows it in a table, together with a hypothetical equity curve you can compare with a world ETF.
It is a variant of the dual momentum idea: look for the ETF with the strongest momentum and hold only that one. I designed it with the French PEA in mind, so that anyone can follow a simple rule-based strategy for their account, but it works with any ETFs available on TradingView.
> This is a systematic framework for study. It does not guarantee results. Backtests are hypothetical and ignore fees, spreads and taxes.
How it works
- Composite momentum: average of the 1, 3, 6 and 12-month returns of each ETF.
- Volatility: annualised standard deviation of daily returns over 252 days (adjustable).
- Score = momentum / volatility. The ETF with the highest score is selected for the month.
- Rotation happens once a month, at the first trading day. 100% of the capital is in the selected ETF. No leverage and no cash position. By default there is no filter: the best-scored ETF is held even if its score is negative.
Default ETF universe (Euronext Paris, PEA-eligible)
- ESE – S&P 500 (United States)
- PUST – Nasdaq-100 (United States, growth)
- MEUD – STOXX Europe 600 (Europe)
- PAEEM – MSCI Emerging Markets
You can replace each of the 4 ETFs in the settings.
Optional regime filter (off by default)
- If you enable it, the indicator checks the benchmark ETF (default CW8, MSCI World) at each monthly rotation. If the benchmark closes below its 200-day simple moving average, the strategy holds the benchmark instead of the best-scored ETF.
- Benchmark and moving average length are adjustable. With the filter off, the behaviour is the pure rotation described above.
How to read it
- Table (top right by default): ETF of the month and its ticker. If the name and the colour of the curve change, it is a rotation signal. If not, nothing to do.
- Equity curve: compounded from the first bar, then rescaled to match the chart price on the anchor date (default 10 June 2019). Load the indicator on a world ETF such as CW8 (MSCI World) on the Daily timeframe to compare the strategy with a buy-and-hold on the same dates.
- Legend table: one colour per ETF.
Settings
- The 4 ETFs, the volatility lookback, the anchor date, the optional regime filter (on/off, benchmark, MA length), and the position and size of the tables.
Important notes
- Works on the Daily timeframe only (the script displays a message otherwise).
- The universe is small and fixed on purpose: fewer rules, fewer parameters to over-optimise.
- Real life differs from a backtest: brokerage fees, spreads, execution at the monthly close and ETF eligibility can change over time.
- This script is educational and is not financial advice.
A simple monthly rotation between a small universe of ETFs. Each month, the indicator picks the ETF with the best risk-adjusted momentum and shows it in a table, together with a hypothetical equity curve you can compare with a world ETF.
It is a variant of the dual momentum idea: look for the ETF with the strongest momentum and hold only that one. I designed it with the French PEA in mind, so that anyone can follow a simple rule-based strategy for their account, but it works with any ETFs available on TradingView.
> This is a systematic framework for study. It does not guarantee results. Backtests are hypothetical and ignore fees, spreads and taxes.
How it works
- Composite momentum: average of the 1, 3, 6 and 12-month returns of each ETF.
- Volatility: annualised standard deviation of daily returns over 252 days (adjustable).
- Score = momentum / volatility. The ETF with the highest score is selected for the month.
- Rotation happens once a month, at the first trading day. 100% of the capital is in the selected ETF. No leverage and no cash position. By default there is no filter: the best-scored ETF is held even if its score is negative.
Default ETF universe (Euronext Paris, PEA-eligible)
- ESE – S&P 500 (United States)
- PUST – Nasdaq-100 (United States, growth)
- MEUD – STOXX Europe 600 (Europe)
- PAEEM – MSCI Emerging Markets
You can replace each of the 4 ETFs in the settings.
Optional regime filter (off by default)
- If you enable it, the indicator checks the benchmark ETF (default CW8, MSCI World) at each monthly rotation. If the benchmark closes below its 200-day simple moving average, the strategy holds the benchmark instead of the best-scored ETF.
- Benchmark and moving average length are adjustable. With the filter off, the behaviour is the pure rotation described above.
How to read it
- Table (top right by default): ETF of the month and its ticker. If the name and the colour of the curve change, it is a rotation signal. If not, nothing to do.
- Equity curve: compounded from the first bar, then rescaled to match the chart price on the anchor date (default 10 June 2019). Load the indicator on a world ETF such as CW8 (MSCI World) on the Daily timeframe to compare the strategy with a buy-and-hold on the same dates.
- Legend table: one colour per ETF.
Settings
- The 4 ETFs, the volatility lookback, the anchor date, the optional regime filter (on/off, benchmark, MA length), and the position and size of the tables.
Important notes
- Works on the Daily timeframe only (the script displays a message otherwise).
- The universe is small and fixed on purpose: fewer rules, fewer parameters to over-optimise.
- Real life differs from a backtest: brokerage fees, spreads, execution at the monthly close and ETF eligibility can change over time.
- This script is educational and is not financial advice.
版本注释
Updated chart preview (CW8, Daily).版本注释
update screen
免责声明
这些信息和出版物并非旨在提供,也不构成TradingView提供或认可的任何形式的财务、投资、交易或其他类型的建议或推荐。请阅读使用条款了解更多信息。