OPEN-SOURCE SCRIPT
已更新 Black Diamond - Liquidity Zones With Alerts V6
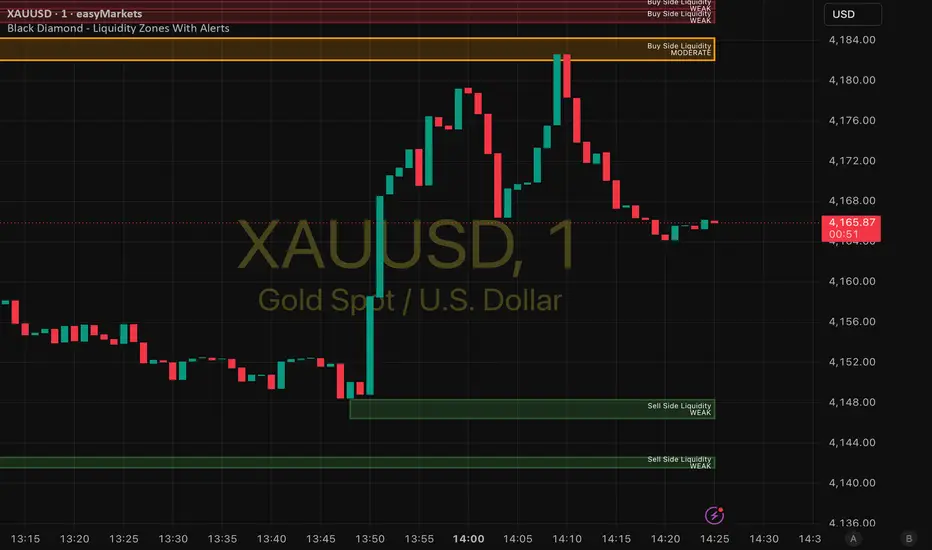
Black Diamond Liquidity Zones With Alerts V6
Indicator Overview
Black Diamond Liquidity Zones V6 is designed to help traders identify areas where liquidity is likely resting within the market. These zones represent locations where stop losses, pending orders, breakout traders and institutional activity are commonly concentrated.
The indicator automatically detects and maps Buy Side and Sell Side liquidity zones using market structure, swing highs, swing lows and volume participation. Each liquidity zone is then classified as Strong, Moderate or Weak, allowing traders to quickly assess the significance of each level.
Unlike traditional support and resistance indicators, Black Diamond Liquidity Zones focuses on where the market is most likely to seek liquidity before making its next move.
The indicator automatically updates active liquidity zones, removes consumed zones and can generate alerts whenever price enters a liquidity area.
Core Features
Automatic Buy Side Liquidity Detection
Identifies liquidity resting above swing highs where:
Stop losses from short traders are likely positioned.
Breakout traders may enter long positions.
Institutions may seek liquidity before reversing.
Automatic Sell Side Liquidity Detection
Identifies liquidity resting below swing lows where:
Stop losses from long traders are likely positioned.
Breakdown traders may enter short positions.
Institutions may seek liquidity before reversing.
Liquidity Strength Classification
Every zone is classified as:
Strong Liquidity
Highest significance liquidity zones.
Typically:
Multiple market reactions
Higher participation
Strong structural importance
Highest probability reaction zones
Moderate Liquidity
Mid-level liquidity concentrations.
Typically:
Average market interaction
Moderate structural importance
Useful intraday targets
Weak Liquidity
Smaller liquidity pools.
Typically:
Limited interaction
Lower significance
Secondary targets
Smart Zone Merging
Nearby liquidity zones are automatically merged into a single larger liquidity pool.
This helps:
Reduce chart clutter
Improve zone quality
Highlight institutional liquidity concentrations
Automatic Liquidity Removal
When liquidity has been consumed:
The zone is automatically deleted.
Only active liquidity remains visible.
Charts remain clean and easy to read.
Built-In Alerts
Generate alerts when:
Price enters Buy Side Liquidity
Price enters Sell Side Liquidity
Price enters Any Liquidity Zone
Perfect for preparing before price reaches important areas.
Understanding Buy Side Liquidity
Buy Side Liquidity exists above previous highs.
Examples include:
Retail stop losses
Short trader exits
Breakout entries
Institutional liquidity targets
Markets frequently move into Buy Side Liquidity before:
Reversing
Continuing trend
Creating liquidity sweeps
Understanding Sell Side Liquidity
Sell Side Liquidity exists below previous lows.
Examples include:
Retail stop losses
Long trader exits
Breakdown entries
Institutional liquidity targets
Markets frequently move into Sell Side Liquidity before:
Reversing
Continuing trend
Creating liquidity sweeps
How To Use The Indicator
Liquidity Sweep Reversal Setup
Step 1
Identify a Strong Liquidity Zone.
Step 2
Wait for price to enter the zone.
Step 3
Watch for:
Rejection candles
Break of structure
Change of character
Fair value gaps
Step 4
Enter once confirmation is present.
Trend Continuation Setup
Step 1
Determine overall market trend.
Step 2
Allow price to sweep opposing liquidity.
Step 3
Wait for structure confirmation.
Step 4
Enter in trend direction.
Profit Targeting
Liquidity zones make excellent profit targets.
For Long Trades:
Target Buy Side Liquidity.
For Short Trades:
Target Sell Side Liquidity.
Best Trading Styles
Black Diamond Liquidity Zones works exceptionally well with:
Smart Money Concepts (SMC)
Liquidity Sweeps
BOS
CHOCH
Mitigation
ICT Concepts
Liquidity Pools
Premium & Discount Arrays
Market Structure Shifts
Price Action Trading
Support & Resistance
Rejection Candles
Trend Trading
Institutional Trading
Order Blocks
Fair Value Gaps
Liquidity Runs
Recommended Timeframes
Scalping
Timeframes:
1 Minute
3 Minute
5 Minute
Recommended Swing Length:
3–5
Intraday Trading
Timeframes:
15 Minute
30 Minute
1 Hour
Recommended Swing Length:
5–8
Swing Trading
Timeframes:
4 Hour
Daily
Recommended Swing Length:
8–15
Indicator Overview
Black Diamond Liquidity Zones V6 is designed to help traders identify areas where liquidity is likely resting within the market. These zones represent locations where stop losses, pending orders, breakout traders and institutional activity are commonly concentrated.
The indicator automatically detects and maps Buy Side and Sell Side liquidity zones using market structure, swing highs, swing lows and volume participation. Each liquidity zone is then classified as Strong, Moderate or Weak, allowing traders to quickly assess the significance of each level.
Unlike traditional support and resistance indicators, Black Diamond Liquidity Zones focuses on where the market is most likely to seek liquidity before making its next move.
The indicator automatically updates active liquidity zones, removes consumed zones and can generate alerts whenever price enters a liquidity area.
Core Features
Automatic Buy Side Liquidity Detection
Identifies liquidity resting above swing highs where:
Stop losses from short traders are likely positioned.
Breakout traders may enter long positions.
Institutions may seek liquidity before reversing.
Automatic Sell Side Liquidity Detection
Identifies liquidity resting below swing lows where:
Stop losses from long traders are likely positioned.
Breakdown traders may enter short positions.
Institutions may seek liquidity before reversing.
Liquidity Strength Classification
Every zone is classified as:
Strong Liquidity
Highest significance liquidity zones.
Typically:
Multiple market reactions
Higher participation
Strong structural importance
Highest probability reaction zones
Moderate Liquidity
Mid-level liquidity concentrations.
Typically:
Average market interaction
Moderate structural importance
Useful intraday targets
Weak Liquidity
Smaller liquidity pools.
Typically:
Limited interaction
Lower significance
Secondary targets
Smart Zone Merging
Nearby liquidity zones are automatically merged into a single larger liquidity pool.
This helps:
Reduce chart clutter
Improve zone quality
Highlight institutional liquidity concentrations
Automatic Liquidity Removal
When liquidity has been consumed:
The zone is automatically deleted.
Only active liquidity remains visible.
Charts remain clean and easy to read.
Built-In Alerts
Generate alerts when:
Price enters Buy Side Liquidity
Price enters Sell Side Liquidity
Price enters Any Liquidity Zone
Perfect for preparing before price reaches important areas.
Understanding Buy Side Liquidity
Buy Side Liquidity exists above previous highs.
Examples include:
Retail stop losses
Short trader exits
Breakout entries
Institutional liquidity targets
Markets frequently move into Buy Side Liquidity before:
Reversing
Continuing trend
Creating liquidity sweeps
Understanding Sell Side Liquidity
Sell Side Liquidity exists below previous lows.
Examples include:
Retail stop losses
Long trader exits
Breakdown entries
Institutional liquidity targets
Markets frequently move into Sell Side Liquidity before:
Reversing
Continuing trend
Creating liquidity sweeps
How To Use The Indicator
Liquidity Sweep Reversal Setup
Step 1
Identify a Strong Liquidity Zone.
Step 2
Wait for price to enter the zone.
Step 3
Watch for:
Rejection candles
Break of structure
Change of character
Fair value gaps
Step 4
Enter once confirmation is present.
Trend Continuation Setup
Step 1
Determine overall market trend.
Step 2
Allow price to sweep opposing liquidity.
Step 3
Wait for structure confirmation.
Step 4
Enter in trend direction.
Profit Targeting
Liquidity zones make excellent profit targets.
For Long Trades:
Target Buy Side Liquidity.
For Short Trades:
Target Sell Side Liquidity.
Best Trading Styles
Black Diamond Liquidity Zones works exceptionally well with:
Smart Money Concepts (SMC)
Liquidity Sweeps
BOS
CHOCH
Mitigation
ICT Concepts
Liquidity Pools
Premium & Discount Arrays
Market Structure Shifts
Price Action Trading
Support & Resistance
Rejection Candles
Trend Trading
Institutional Trading
Order Blocks
Fair Value Gaps
Liquidity Runs
Recommended Timeframes
Scalping
Timeframes:
1 Minute
3 Minute
5 Minute
Recommended Swing Length:
3–5
Intraday Trading
Timeframes:
15 Minute
30 Minute
1 Hour
Recommended Swing Length:
5–8
Swing Trading
Timeframes:
4 Hour
Daily
Recommended Swing Length:
8–15
版本注释
Just a quick change in the name by deleting the V6开源脚本
秉承TradingView的精神,该脚本的作者将其开源,以便交易者可以查看和验证其功能。向作者致敬!您可以免费使用该脚本,但请记住,重新发布代码须遵守我们的网站规则。

免责声明
这些信息和出版物并非旨在提供,也不构成TradingView提供或认可的任何形式的财务、投资、交易或其他类型的建议或推荐。请阅读使用条款了解更多信息。
开源脚本
秉承TradingView的精神,该脚本的作者将其开源,以便交易者可以查看和验证其功能。向作者致敬!您可以免费使用该脚本,但请记住,重新发布代码须遵守我们的网站规则。
免责声明
这些信息和出版物并非旨在提供,也不构成TradingView提供或认可的任何形式的财务、投资、交易或其他类型的建议或推荐。请阅读使用条款了解更多信息。