OPEN-SOURCE SCRIPT
Dynamic ATR v1.0
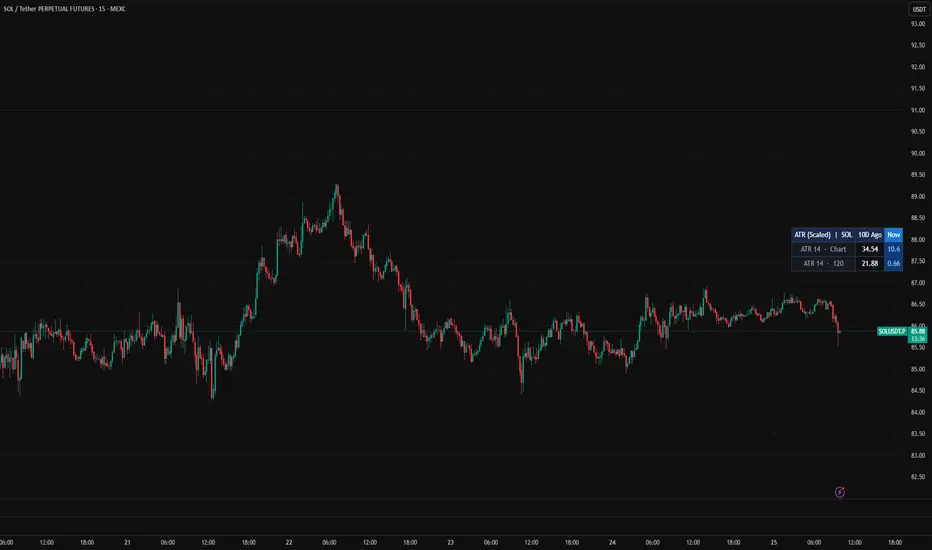
Dynamic ATR displays the Average True Range of any token across two timeframes — the chart timeframe and a configurable higher timeframe (default 2H) — with an…Dynamic ATR displays the Average True Range of any token across two timeframes — the chart timeframe and a configurable higher timeframe (default 2H) — with an optional 0–50 normalization that scales each ATR value relative to its own 360-bar history, making volatility directly comparable across different tokens regardless of their price magnitude. Alongside the current readings, it also shows a snapshot of both ATR values from 10 calendar days ago, giving you a quick sense of whether volatility has expanded or contracted recently. The result is a compact table you can position anywhere on the chart, useful for scanning multiple tokens side by side and spotting which ones are in high or low volatility regimes relative to their own history.
Created by Milad Saberi — April 2026
Created by Milad Saberi — April 2026
开源脚本
秉承TradingView的精神,该脚本的作者将其开源,以便交易者可以查看和验证其功能。向作者致敬!您可以免费使用该脚本,但请记住,重新发布代码须遵守我们的网站规则。

免责声明
这些信息和出版物并非旨在提供,也不构成TradingView提供或认可的任何形式的财务、投资、交易或其他类型的建议或推荐。请阅读使用条款了解更多信息。
开源脚本
秉承TradingView的精神,该脚本的作者将其开源,以便交易者可以查看和验证其功能。向作者致敬!您可以免费使用该脚本,但请记住,重新发布代码须遵守我们的网站规则。
免责声明
这些信息和出版物并非旨在提供,也不构成TradingView提供或认可的任何形式的财务、投资、交易或其他类型的建议或推荐。请阅读使用条款了解更多信息。