NQ - LOD\HOD + QQQ levels + VXN [ F3L1X the DEV ]
 QQQ
 NDX VXN NQ1!
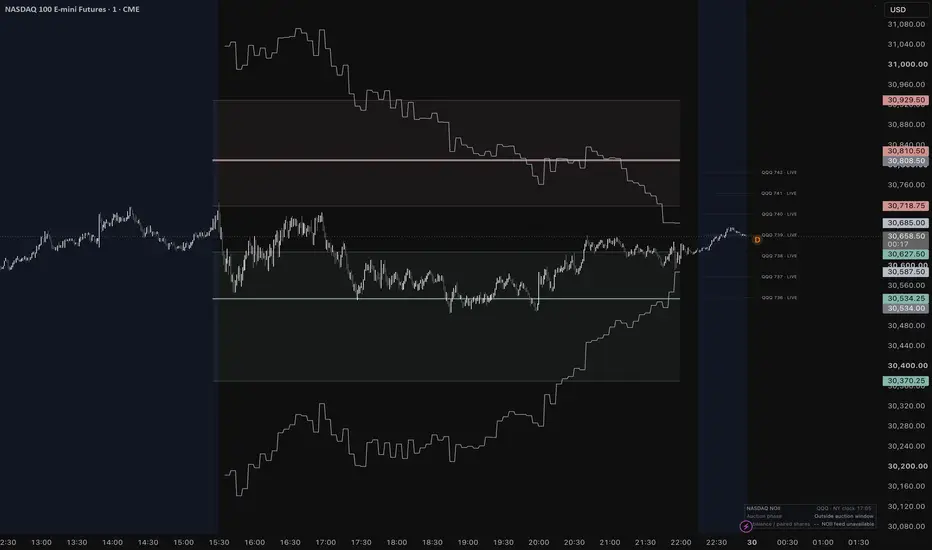
A session-planning indicator for QQQ, NDX, and NQ that combines frozen daily high/low forecast zones, mapped QQQ price levels, and a separate live volatility reference.
The indicator separates the outlook available before the US cash open from information that develops during the session. The main forecast freezes at 09:25 New York time, while the live reference updates using confirmed market data.
What the indicator displays
1. Frozen HOD / LOD forecast zones
Before the cash session opens, the model estimates zones for the upcoming regular-session High of Day (HOD) and Low of Day (LOD).
Each zone contains three levels:
- Lower boundary
- Median estimate
- Upper boundary
The forecast uses historical session behavior, overnight range information, and a volatility model. It freezes at 09:25 New York time and remains fixed for that session.
The boundaries represent estimated 20th and 80th quantiles, with a median estimate between them. These are forecast ranges—not guaranteed support, resistance, or reversal levels.
The underlying forecast is calculated from NQ. On QQQ and NDX charts, the indicator converts that forecast into the selected instrument’s price units.
2. QQQ price-level mapping
The QQQ grid displays nearby round-number QQQ levels on supported charts.
- On QQQ, these are native QQQ price levels.
- On NQ, the levels are converted using synchronized QQQ and NQ prices.
- On NDX, live mapping requires synchronized QQQ and NDX prices.
You can choose between a frozen mapping and a live mapping. Frozen mapping provides a stable reference; live mapping reflects changes in the relationship between instruments.
These are price-based reference levels. They are not measured option positioning, gamma exposure, or confirmed option walls.
3. Separate live IV reference
The live volatility reference is independent of the frozen HOD/LOD forecast. It estimates a price-move range for the time remaining in the regular cash session.
Two inputs are available:
- VXN proxy: Uses Nasdaq-100 implied volatility as a broad volatility reference.
- Manual QQQ 0DTE IV: Lets you enter a current QQQ same-day implied-volatility reading and its timestamp.
VXN measures approximately 30-day implied volatility; it is not a direct 0DTE IV feed. The manual input requires an external source and must be updated by the user.
The displayed range is a volatility-based approximation. It is not a calibrated probability interval or a prediction of where price must finish.
4. Nasdaq NOII timing box
The compact NOII box identifies the scheduled Nasdaq opening and closing imbalance windows:
Window New York time
Opening — early 09:25–09:28
Opening — full 09:28–09:30
Closing — early 15:50–15:55
Closing — full 15:55–16:00
This is a timing reference, not a live NOII data feed. It does not display actual imbalance direction, imbalance size, paired shares, or indicative auction prices.
How to use it
1. Open a standard QQQ, NDX, or NQ1! chart on the 1-minute or 5-minute timeframe.
2. Allow sufficient historical data to load.
3. After 09:25 New York time, check that the frozen forecast is available.
4. Use the HOD/LOD zones to frame the session’s potential extremes.
5. Use mapped QQQ levels as additional price references.
6. During regular trading hours, monitor the separate live IV reference and its data timestamp.
7. Check the status panel for missing, stale, or unsynchronized data before interpreting a level.
For example, if price approaches the upper HOD zone near a mapped QQQ level, that identifies an area worth observing. It does not automatically imply a short entry. Price action, execution rules, and risk management remain separate decisions.
Important differences between instruments
QQQ: Native QQQ levels are displayed alongside the converted NQ forecast.
NQ: The forecast uses the back-adjusted continuous NQ contract. Contract rolls and differences between data feeds can affect cross-instrument relationships.
NDX: The cash index is not available at 09:25. Its frozen forecast therefore uses a prior synchronized cash-session relationship and is explicitly a prior-cash-basis projection.
The three displays are linked projections, not three independently trained forecasting models.
Reading the statistics
The optional audit panel reports historical NQ forecast coverage:
- HOD coverage: How often the session high fell inside the predicted HOD zone.
- LOD coverage: How often the session low fell inside the predicted LOD zone.
- Joint coverage: How often both extremes fell inside their respective zones.
These statistics are not a trading win rate. They do not measure profit, transaction costs, slippage, or the performance of a defined entry-and-exit strategy. Results depend on the available history, settings, and data feed.
QQQ and NDX projections should not be interpreted as independently validated performance statistics for those instruments.
Data and research limitations
The indicator is designed to support session analysis, including 0DTE-oriented workflows, but it does not ingest a live options chain, dealer positions, gamma exposure, or actual NOII messages.
Research did not establish a statistically reliable improvement from adding the tested IV feature directly to the core forecast. IV is therefore retained as a separate contextual reference.
Live calculations use confirmed data and may lag the currently forming bar. Delayed subscriptions, closed cash markets, and mismatched timestamps can make some references unavailable. The panel exposes these conditions rather than silently treating stale values as current.
Use this indicator as an analytical tool—not as a standalone trading system or a guarantee of future results.
Credits
The cross-instrument price-mapping concept was informed by QQQ NDX NQ Price by PtGambler. This implementation adds a shared frozen forecast, timestamp checks, separate live IV context, and session-status information.

免责声明
这些信息和出版物并非旨在提供,也不构成TradingView提供或认可的任何形式的财务、投资、交易或其他类型的建议或推荐。请阅读使用条款了解更多信息。
免责声明
这些信息和出版物并非旨在提供,也不构成TradingView提供或认可的任何形式的财务、投资、交易或其他类型的建议或推荐。请阅读使用条款了解更多信息。