Multi-Timeframe Liquidity Pool Ledger [Jayadev Rana]
WHAT IT IS
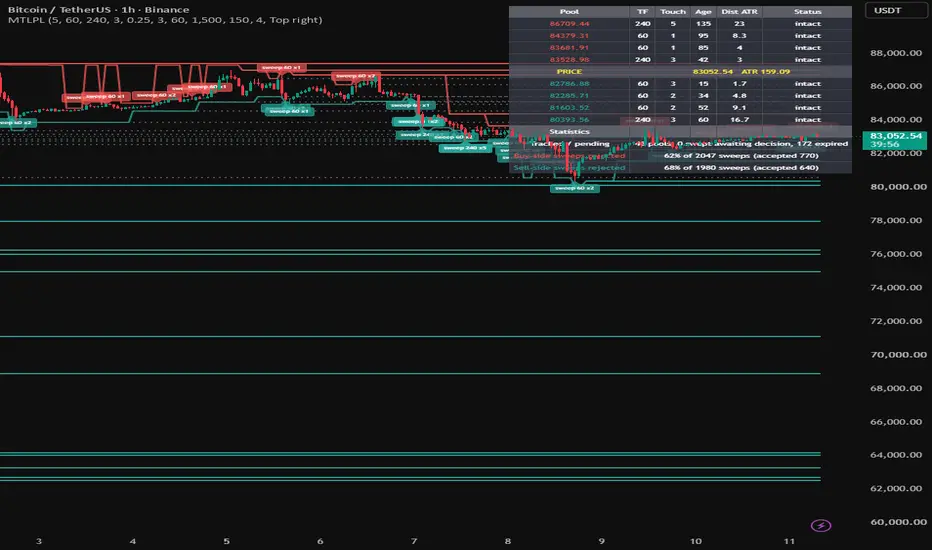
Multi-Timeframe Liquidity Pool Ledger finds places where resting orders tend to build up (equal highs and equal lows made of clustered swing points), follows every one of those pools through its life, and keeps a ledger of what happened when price reached them. It is an information tool for traders who think in terms of liquidity and sweeps. It does not produce entry or exit signals.
HOW IT WORKS
1. Swing points from three timeframes. Confirmed pivot highs and lows are taken from the chart timeframe and from two higher timeframes chosen in the inputs. Higher-timeframe pivots are requested without lookahead, so they appear on the chart only after the required number of higher-timeframe bars has closed to the right of the pivot.
2. Clustering into pools. A new swing level is compared with the intact pools on the same side. If it lies within the tolerance (ATR x input) of an existing pool, the pool absorbs it: the touch count increases, the pool price becomes the touch-weighted average and the pool inherits the highest timeframe involved. Otherwise a new pool is created. This is how "equal highs" and "equal lows" are detected without requiring exact ties.
3. Sweep state machine. Each pool is intact until price trades through it. It is then marked swept, and for the next decision window (bars input) the script watches the closes. If a close returns to the original side of the pool inside that window the sweep is logged as rejected; if not, it is logged as accepted. The maximum excursion beyond the pool is recorded in ATR. Resolved pools stay on the chart for a configurable number of bars and are then removed; intact pools expire after a maximum age. The total number of pools is capped.
4. Statistics. Counts of rejected and accepted sweeps are kept separately for buy-side pools (highs) and sell-side pools (lows), giving the historical rejection rate on this chart.
ON THE CHART
Each pool is a horizontal line from the bar of its first swing to the current bar; width grows with the timeframe of the pool and the line turns dotted and grey once the sweep is resolved. The nearest intact pool above and below the close are plotted as step lines. Small triangles mark the bar on which a pool was swept and optional labels show the timeframe and touch count of the swept pool.
THE LEDGER TABLE
A price ladder: the nearest N pools above price (farthest first), a price row with the current close and ATR, then the nearest N pools below. Each row shows the pool price, timeframe, touches, age in bars, distance in ATR and status (intact, swept, rejected, accepted). Below the ladder: pools tracked, sweeps awaiting a decision, expired pools, and the rejection rate of buy-side and sell-side sweeps with the sample size.
INPUTS
Pivot detection: chart pivot strength, two higher timeframes, higher-timeframe pivot strength.
Pool rules: equal-level tolerance in ATR, sweep decision bars, maximum pools, intact-pool expiry, how long resolved pools stay visible.
Display: pool lines, sweep labels, table, pools per side, table position, colours.
ALERTS
Buy-side pool swept, sell-side pool swept, sweep rejected, sweep accepted. Informational only.
INTENDED USE
Any liquid market. Intraday traders can use a 5 or 15 minute chart with 60 and 240 as higher timeframes; swing traders a 1 hour or 4 hour chart with daily and weekly higher timeframes.
LIMITATIONS
Pivots confirm late by construction, so a pool appears only after its right-side bars have closed, and higher-timeframe pools appear later still. The rejection and acceptance statistics describe the loaded history of this chart only and are not forecasts. Data-window plots show the nearest pool distances and counts for alert building or further analysis.
This is an analytical tool, not financial advice.
Multi-Timeframe Liquidity Pool Ledger finds places where resting orders tend to build up (equal highs and equal lows made of clustered swing points), follows every one of those pools through its life, and keeps a ledger of what happened when price reached them. It is an information tool for traders who think in terms of liquidity and sweeps. It does not produce entry or exit signals.
HOW IT WORKS
1. Swing points from three timeframes. Confirmed pivot highs and lows are taken from the chart timeframe and from two higher timeframes chosen in the inputs. Higher-timeframe pivots are requested without lookahead, so they appear on the chart only after the required number of higher-timeframe bars has closed to the right of the pivot.
2. Clustering into pools. A new swing level is compared with the intact pools on the same side. If it lies within the tolerance (ATR x input) of an existing pool, the pool absorbs it: the touch count increases, the pool price becomes the touch-weighted average and the pool inherits the highest timeframe involved. Otherwise a new pool is created. This is how "equal highs" and "equal lows" are detected without requiring exact ties.
3. Sweep state machine. Each pool is intact until price trades through it. It is then marked swept, and for the next decision window (bars input) the script watches the closes. If a close returns to the original side of the pool inside that window the sweep is logged as rejected; if not, it is logged as accepted. The maximum excursion beyond the pool is recorded in ATR. Resolved pools stay on the chart for a configurable number of bars and are then removed; intact pools expire after a maximum age. The total number of pools is capped.
4. Statistics. Counts of rejected and accepted sweeps are kept separately for buy-side pools (highs) and sell-side pools (lows), giving the historical rejection rate on this chart.
ON THE CHART
Each pool is a horizontal line from the bar of its first swing to the current bar; width grows with the timeframe of the pool and the line turns dotted and grey once the sweep is resolved. The nearest intact pool above and below the close are plotted as step lines. Small triangles mark the bar on which a pool was swept and optional labels show the timeframe and touch count of the swept pool.
THE LEDGER TABLE
A price ladder: the nearest N pools above price (farthest first), a price row with the current close and ATR, then the nearest N pools below. Each row shows the pool price, timeframe, touches, age in bars, distance in ATR and status (intact, swept, rejected, accepted). Below the ladder: pools tracked, sweeps awaiting a decision, expired pools, and the rejection rate of buy-side and sell-side sweeps with the sample size.
INPUTS
Pivot detection: chart pivot strength, two higher timeframes, higher-timeframe pivot strength.
Pool rules: equal-level tolerance in ATR, sweep decision bars, maximum pools, intact-pool expiry, how long resolved pools stay visible.
Display: pool lines, sweep labels, table, pools per side, table position, colours.
ALERTS
Buy-side pool swept, sell-side pool swept, sweep rejected, sweep accepted. Informational only.
INTENDED USE
Any liquid market. Intraday traders can use a 5 or 15 minute chart with 60 and 240 as higher timeframes; swing traders a 1 hour or 4 hour chart with daily and weekly higher timeframes.
LIMITATIONS
Pivots confirm late by construction, so a pool appears only after its right-side bars have closed, and higher-timeframe pools appear later still. The rejection and acceptance statistics describe the loaded history of this chart only and are not forecasts. Data-window plots show the nearest pool distances and counts for alert building or further analysis.
This is an analytical tool, not financial advice.

免责声明
这些信息和出版物并非旨在提供,也不构成TradingView提供或认可的任何形式的财务、投资、交易或其他类型的建议或推荐。请阅读使用条款了解更多信息。
免责声明
这些信息和出版物并非旨在提供,也不构成TradingView提供或认可的任何形式的财务、投资、交易或其他类型的建议或推荐。请阅读使用条款了解更多信息。