OPEN-SOURCE SCRIPT
Ultimate Robust VP Scorecard HUD
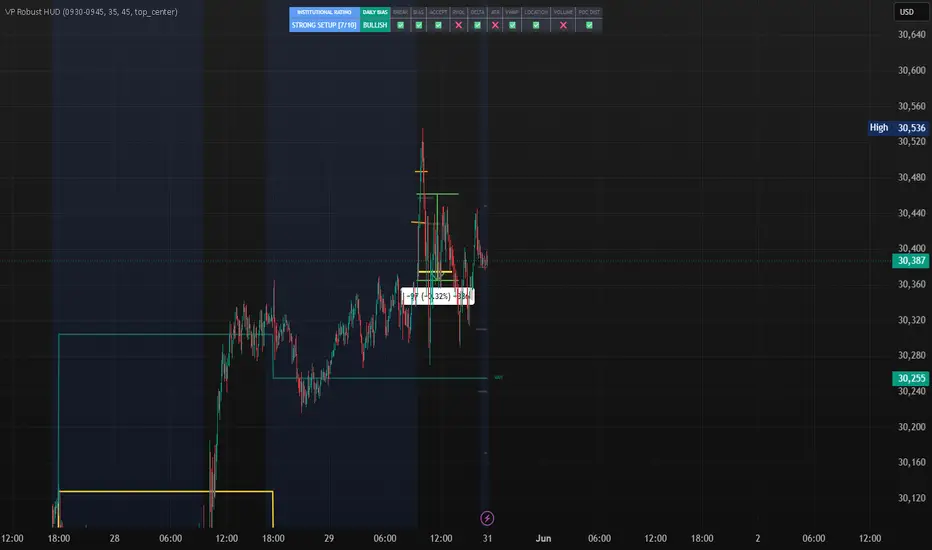
VOLUME PROFILE BIAS DASHBOARD STRATEGY
CORE PHILOSOPHY
The strategy answers three questions:
1. DIRECTION (MACRO BIAS)
Determine the overall market bias using the 5-Day Volume Profile.
Rules:
• Price Above 5-Day VAH = Bullish Macro Bias
• Price At or Near 5-Day POC = Neutral Macro Bias
• Price Below 5-Day VAL = Bearish Macro Bias
The 5-Day Profile shows where value has been accepted over the last week.
Highest conviction occurs when Macro Bias and Session Bias agree.
--------------------------------------------------
2. SESSION CONTEXT (DAILY BIAS)
Determine the session bias using yesterday's volume profile.
Rules:
• Today's Open Above Yesterday VAH = Bullish Session Bias
• Today's Open Inside Yesterday Value Area = Neutral Session Bias
• Today's Open Below Yesterday VAL = Bearish Session Bias
Interpretation:
• Above VAH = Buyers accepted higher prices
• Inside Value = Balance / Chop
• Below VAL = Sellers accepted lower prices
--------------------------------------------------
3. LOCATION (KEY LEVELS)
Automatically calculate and display:
• Previous Session VAH
• Previous Session VAL
• Previous Session POC
• 5-Day VAH
• 5-Day VAL
• 5-Day POC
• HVNs (High Volume Nodes)
• LVNs (Low Volume Nodes)
• Hidden Bumps
These become the reaction zones and profit targets.
==================================================
DASHBOARD SCORECARD
Display in the top-right corner.
Bias Score (1 Point Each)
✅ Price Above 5-Day VAH
✅ Open Above Yesterday VAH
✅ Current Price Above Yesterday VAH
✅ Acceptance Outside Value Area
✅ Relative Volume Above Average
Total Score:
5/5 = A+ Bullish
4/5 = Strong Bullish
3/5 = Neutral
2/5 = Weak
0-1/5 = Bearish
Reverse the logic for bearish conditions.
==================================================
DASHBOARD DISPLAY
Macro Context:
• Bullish
• Neutral
• Bearish
Session Context:
• Bullish
• Neutral
• Bearish
Open Location:
• Above VAH
• Inside Value
• Below VAL
Current Location:
• Above VAH
• Inside Value
• Below VAL
Acceptance Status:
• Accepted Above Value
• Accepted Below Value
• Inside Value
Relative Volume:
• Strong
• Average
• Weak
Overall Bias Score:
• 0-5
Trade Rating:
• A+
• Strong
• Neutral
• Weak
• Bearish
==================================================
LONG SETUP
Requirements:
Macro:
✅ Price Above 5-Day VAH
Session:
✅ Open Above Yesterday VAH
Trigger:
✅ Pullback Holds VAH
Entry:
• Buy Acceptance Above VAH
Stop:
• Below VAH
Targets:
• Next HVN
• Next Hidden Bump
• Next VAH
• Major Volume Node
==================================================
SHORT SETUP
Requirements:
Macro:
✅ Price Below 5-Day VAL
Session:
✅ Open Below Yesterday VAL
Trigger:
✅ Retest Fails Below VAL
Entry:
• Sell Acceptance Below VAL
Stop:
• Above VAL
Targets:
• Next LVN
• Next Hidden Bump
• Next VAL
• Major Volume Node
==================================================
NO TRADE CONDITIONS
Avoid trading when:
❌ Open Inside Value Area
❌ Current Price Inside Value Area
❌ Macro Bias and Session Bias Disagree
❌ Relative Volume Is Weak
❌ Acceptance Is Not Confirmed
Display:
"NO TRADE - INSIDE VALUE"
or
"NO TRADE - CONFLICTING BIAS"
==================================================
IMPORTANT CONCEPTS
Value Area
• Area containing approximately 70% of the session's volume.
VAH (Value Area High)
• Upper edge of accepted value.
VAL (Value Area Low)
• Lower edge of accepted value.
POC (Point of Control)
• Price level with the highest volume traded.
• Acts as the market's center of gravity.
HVN (High Volume Node)
• Price area where the market accepted value.
• Often acts as support or resistance.
LVN (Low Volume Node)
• Price area where little volume traded.
• Price often moves quickly through these zones.
Hidden Bumps
• Aggressive institutional positioning zones inside thin profiles.
• Often create strong reactions.
==================================================
TRADING LOGIC
The strategy only answers three questions:
1. Direction
• Bullish
• Bearish
• Neutral
2. Location
• VAH
• VAL
• POC
• HVN
• LVN
• Hidden Bump
3. Trigger
• Acceptance Above Value
• Acceptance Below Value
• Pullback Hold
• Retest Failure
Everything else is noise.
==================================================
ULTIMATE GOAL
Create a Volume Profile Bias Dashboard that automatically identifies:
• 5-Day Macro Bias
• Daily Session Bias
• Opening Location
• Acceptance Outside Value
• HVNs
• LVNs
• Hidden Bumps
• Key Targets
Then generate:
• Bullish Trade Opportunities
• Bearish Trade Opportunities
• No Trade Conditions
The objective is to determine whether the market is accepting higher value, lower value, or remaining balanced before executing a trade.
开源脚本
秉承TradingView的精神,该脚本的作者将其开源,以便交易者可以查看和验证其功能。向作者致敬!您可以免费使用该脚本,但请记住,重新发布代码须遵守我们的网站规则。

免责声明
这些信息和出版物并非旨在提供,也不构成TradingView提供或认可的任何形式的财务、投资、交易或其他类型的建议或推荐。请阅读使用条款了解更多信息。
开源脚本
秉承TradingView的精神,该脚本的作者将其开源,以便交易者可以查看和验证其功能。向作者致敬!您可以免费使用该脚本,但请记住,重新发布代码须遵守我们的网站规则。
免责声明
这些信息和出版物并非旨在提供,也不构成TradingView提供或认可的任何形式的财务、投资、交易或其他类型的建议或推荐。请阅读使用条款了解更多信息。