30/50/180 SMAs
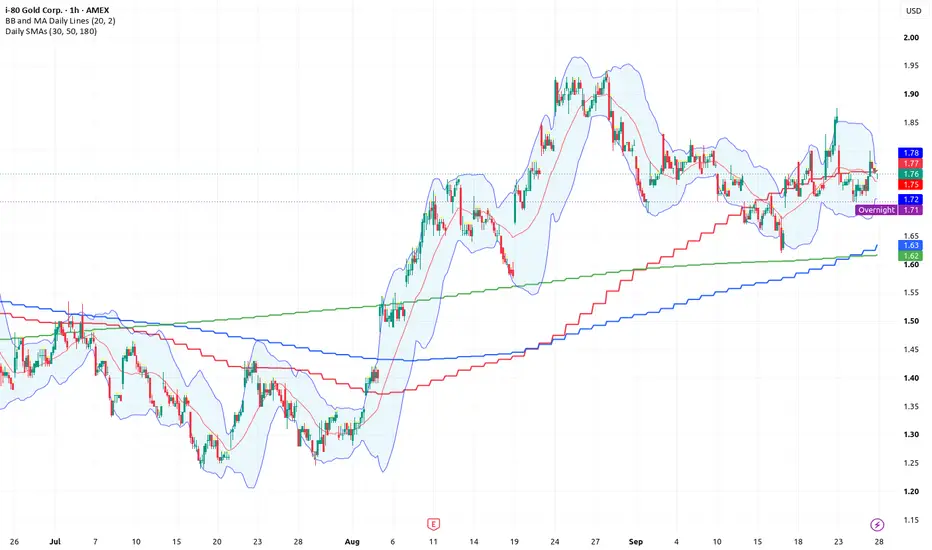
30-Day SMA — Short/Intermediate Term
The 30-day SMA reacts relatively quickly to changes in price.
Rising → short/intermediate trend is strengthening
Falling → trend is weakening
Price above SMA → generally positive short-term structure
Price below SMA → generally negative short-term structure
Best for: identifying recent trend direction and pullbacks.
50-Day SMA — Intermediate Term
The 50-day SMA is one of the most commonly watched moving averages. It is slower and more stable than the 30-day SMA.
Rising 50 SMA → intermediate trend is generally positive
Falling 50 SMA → intermediate trend is generally negative
Price crossing the 50 SMA → potentially important change in intermediate momentum
Best for: confirming whether a short-term move is consistent with the broader intermediate trend.
180-Day SMA — Long Term
The 180-day SMA is much slower and filters out considerably more short-term market noise.
It represents roughly 9 months of trading history.
Rising → long-term trend is generally positive
Falling → long-term trend is generally negative
Price testing the 180 SMA → potentially important long-term trend level
Best for: determining whether the stock's overall long-term trend is still intact.
The 30-day SMA reacts relatively quickly to changes in price.
Rising → short/intermediate trend is strengthening
Falling → trend is weakening
Price above SMA → generally positive short-term structure
Price below SMA → generally negative short-term structure
Best for: identifying recent trend direction and pullbacks.
50-Day SMA — Intermediate Term
The 50-day SMA is one of the most commonly watched moving averages. It is slower and more stable than the 30-day SMA.
Rising 50 SMA → intermediate trend is generally positive
Falling 50 SMA → intermediate trend is generally negative
Price crossing the 50 SMA → potentially important change in intermediate momentum
Best for: confirming whether a short-term move is consistent with the broader intermediate trend.
180-Day SMA — Long Term
The 180-day SMA is much slower and filters out considerably more short-term market noise.
It represents roughly 9 months of trading history.
Rising → long-term trend is generally positive
Falling → long-term trend is generally negative
Price testing the 180 SMA → potentially important long-term trend level
Best for: determining whether the stock's overall long-term trend is still intact.

免责声明
这些信息和出版物并非旨在提供,也不构成TradingView提供或认可的任何形式的财务、投资、交易或其他类型的建议或推荐。请阅读使用条款了解更多信息。
免责声明
这些信息和出版物并非旨在提供,也不构成TradingView提供或认可的任何形式的财务、投资、交易或其他类型的建议或推荐。请阅读使用条款了解更多信息。