OPEN-SOURCE SCRIPT
已更新 The Small Guardian - Interactive Volume Range Tool
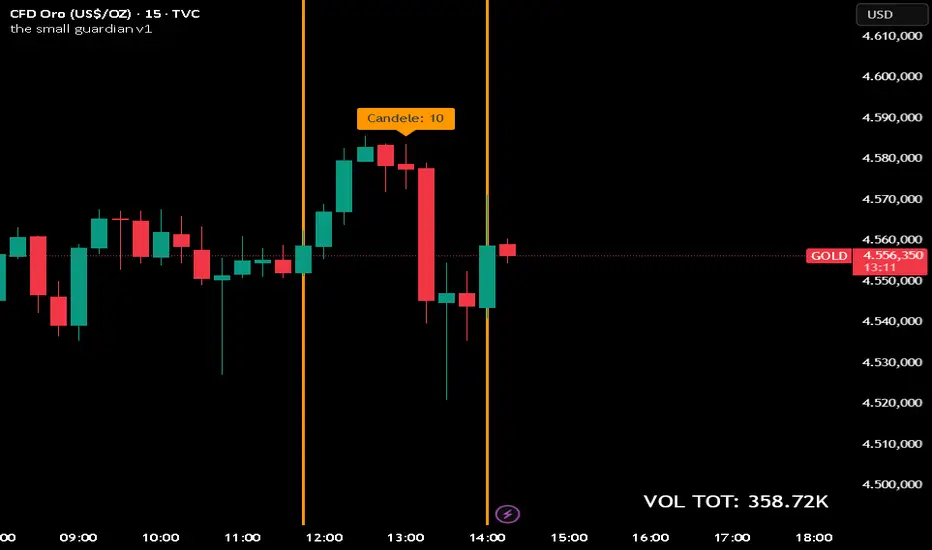
The Small Guardian is a minimalist, high-visibility utility designed for traders who need to calculate the exact traded volume between two specific points on their chart with just a few clicks.
Unlike standard volume profiles or historical indicators, this script is built for on-the-fly manual measurement. It removes all the clutter of technical analysis and focuses on one thing: giving you the total volume of a selected range instantly.
Key Features
Interactive Selection: Uses the native TradingView "confirm" mode. Simply click on the first candle and then the second candle to define your range.
High Visibility: Features thick, orange vertical lines that clearly mark your selected boundaries.
Smart Labeling: Automatically displays the candle count in a floating orange label above the selected range for quick reference.
Large Display Table: Shows the Total Volume in a large, easy-to-read table at the bottom right of your chart.
Zero Lag: Optimized to run only on the latest bar, ensuring your chart remains fast and responsive.
How to Use
Add The Small Guardian to your chart.
Your cursor will turn into a crosshair. Click on the Starting Candle.
Click on the Ending Candle.
The total volume will appear in the bottom-right table, and the candle count will be displayed above the price action.
To change the selection: Open the indicator settings (cogwheel icon) and click the calendar/chart icon next to the "Start" and "End" inputs to pick new points.
Disclaimer & Terms of Use
Not Financial Advice: This script is for educational and informational purposes only. It is a tool to assist in data visualization and does not constitute financial, investment, or trading advice.
Risk Disclosure: Trading involves significant risk. Always perform your own due diligence before making any market decisions.
No Warranty: This indicator is provided "as is" without any warranties. The author is not responsible for any financial losses incurred through the use of this script.
Open Source: You are free to use and modify this script for personal use, but please provide credit if you redistribute it or use parts of the logic in your own public publications.
Unlike standard volume profiles or historical indicators, this script is built for on-the-fly manual measurement. It removes all the clutter of technical analysis and focuses on one thing: giving you the total volume of a selected range instantly.
Key Features
Interactive Selection: Uses the native TradingView "confirm" mode. Simply click on the first candle and then the second candle to define your range.
High Visibility: Features thick, orange vertical lines that clearly mark your selected boundaries.
Smart Labeling: Automatically displays the candle count in a floating orange label above the selected range for quick reference.
Large Display Table: Shows the Total Volume in a large, easy-to-read table at the bottom right of your chart.
Zero Lag: Optimized to run only on the latest bar, ensuring your chart remains fast and responsive.
How to Use
Add The Small Guardian to your chart.
Your cursor will turn into a crosshair. Click on the Starting Candle.
Click on the Ending Candle.
The total volume will appear in the bottom-right table, and the candle count will be displayed above the price action.
To change the selection: Open the indicator settings (cogwheel icon) and click the calendar/chart icon next to the "Start" and "End" inputs to pick new points.
Disclaimer & Terms of Use
Not Financial Advice: This script is for educational and informational purposes only. It is a tool to assist in data visualization and does not constitute financial, investment, or trading advice.
Risk Disclosure: Trading involves significant risk. Always perform your own due diligence before making any market decisions.
No Warranty: This indicator is provided "as is" without any warranties. The author is not responsible for any financial losses incurred through the use of this script.
Open Source: You are free to use and modify this script for personal use, but please provide credit if you redistribute it or use parts of the logic in your own public publications.
版本注释
I made a small update to the script by replacing only the chart image associated with it, without altering the underlying logic or functionality of the code itself. The purpose of this change was simply to improve the visual presentation and ensure that the graphic more accurately reflects the current version of the indicator. All calculations, signals, and behaviors remain exactly the same as before. This update is purely cosmetic and does not introduce any modifications to the script’s core features or performance.开源脚本
秉承TradingView的精神,该脚本的作者将其开源,以便交易者可以查看和验证其功能。向作者致敬!您可以免费使用该脚本,但请记住,重新发布代码须遵守我们的网站规则。

免责声明
这些信息和出版物并非旨在提供,也不构成TradingView提供或认可的任何形式的财务、投资、交易或其他类型的建议或推荐。请阅读使用条款了解更多信息。
开源脚本
秉承TradingView的精神,该脚本的作者将其开源,以便交易者可以查看和验证其功能。向作者致敬!您可以免费使用该脚本,但请记住,重新发布代码须遵守我们的网站规则。
免责声明
这些信息和出版物并非旨在提供,也不构成TradingView提供或认可的任何形式的财务、投资、交易或其他类型的建议或推荐。请阅读使用条款了解更多信息。