OPEN-SOURCE SCRIPT
Advanced Market Structure & Institutional Dynamic Flow Pro
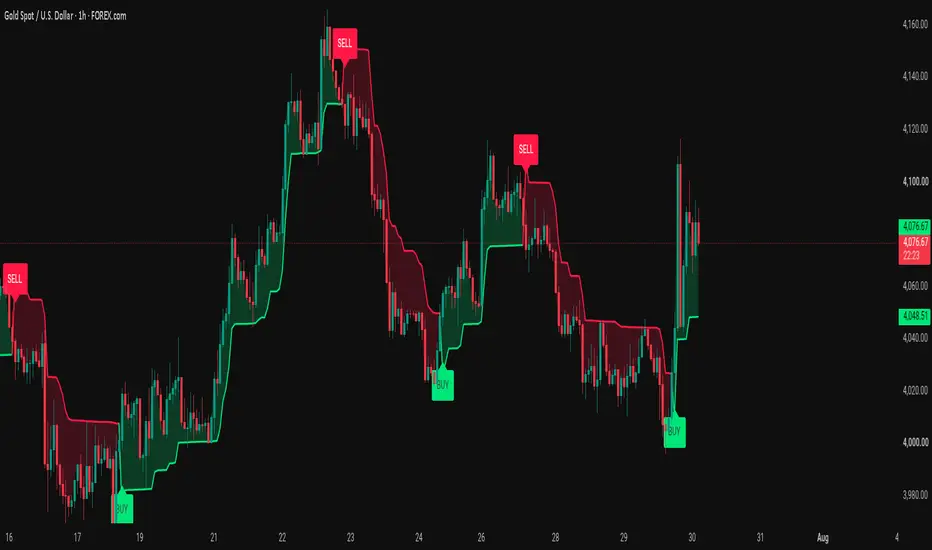
Advanced Market Structure and Institutional Dynamic Flow Pro is a clean and visual indicator built for Pine Script v6. It combines dynamic market structure tracking with curved trend acceleration bands to provide clear directional clarity across various market conditions.
The indicator tracks momentum changes using ATR-based volatility parameters and plots accelerating curved bands that dynamically follow price movement, accompanied by background visual shading and real-time BUY and SELL signals.
Core Features
Curved Radius Trend Acceleration
Maps market trends using a curved band calculation that adjusts as a trend progresses.
Helps visualize trend acceleration and trailing reference levels visually on the chart.
Color coded green during bullish market structure and red during bearish market structure.
Dynamic Trend Fill Shadow
Fills the area between the price and the curved tracking band to highlight trend expansion and contraction.
Shading opacity can be customized in the settings panel.
Structural Entry Badges
Displays BUY labels below swing lows when market structure shifts bullish.
Displays SELL labels above swing highs when market structure shifts bearish.
Settings Breakdown
Supertrend Settings
ATR Length: Adjusts the lookback period for Average True Range calculations (Default: 14).
ATR Multiplier: Controls the distance of the base bands from price (Default: 2.0).
Curve Settings
Radius Curve Acceleration: Controls how tightly or broadly the band curves toward price over time (Default: 0.015).
Visual Settings
Fill Transparency (0-100): Adjusts the transparency of the background trend fill.
How to Use
Trend Direction: Observe the color of the curved tracking line and background shading (Green = Bullish, Red = Bearish).
Signal Confirmation: Watch for BUY and SELL visual markers to identify trend transitions.
Volatility Tracking: Use the curve acceleration to gauge how fast or smooth a trend is progressing.
Things to Avoid
Avoid Isolation Trading: Do not rely solely on single signals; combine them with major market structure levels and overall chart context.
Avoid Default Settings on Extreme Timeframes: Adjust ATR and curve sensitivity parameters when switching between high and low timeframes for optimal visibility.
Disclaimer
Trading financial markets involves risk and can result in the loss of capital. This script is designed for educational and analytical purposes to assist with chart visualization. It is not financial advice or a guarantee of performance. Always conduct independent analysis and maintain risk management practices.
The indicator tracks momentum changes using ATR-based volatility parameters and plots accelerating curved bands that dynamically follow price movement, accompanied by background visual shading and real-time BUY and SELL signals.
Core Features
Curved Radius Trend Acceleration
Maps market trends using a curved band calculation that adjusts as a trend progresses.
Helps visualize trend acceleration and trailing reference levels visually on the chart.
Color coded green during bullish market structure and red during bearish market structure.
Dynamic Trend Fill Shadow
Fills the area between the price and the curved tracking band to highlight trend expansion and contraction.
Shading opacity can be customized in the settings panel.
Structural Entry Badges
Displays BUY labels below swing lows when market structure shifts bullish.
Displays SELL labels above swing highs when market structure shifts bearish.
Settings Breakdown
Supertrend Settings
ATR Length: Adjusts the lookback period for Average True Range calculations (Default: 14).
ATR Multiplier: Controls the distance of the base bands from price (Default: 2.0).
Curve Settings
Radius Curve Acceleration: Controls how tightly or broadly the band curves toward price over time (Default: 0.015).
Visual Settings
Fill Transparency (0-100): Adjusts the transparency of the background trend fill.
How to Use
Trend Direction: Observe the color of the curved tracking line and background shading (Green = Bullish, Red = Bearish).
Signal Confirmation: Watch for BUY and SELL visual markers to identify trend transitions.
Volatility Tracking: Use the curve acceleration to gauge how fast or smooth a trend is progressing.
Things to Avoid
Avoid Isolation Trading: Do not rely solely on single signals; combine them with major market structure levels and overall chart context.
Avoid Default Settings on Extreme Timeframes: Adjust ATR and curve sensitivity parameters when switching between high and low timeframes for optimal visibility.
Disclaimer
Trading financial markets involves risk and can result in the loss of capital. This script is designed for educational and analytical purposes to assist with chart visualization. It is not financial advice or a guarantee of performance. Always conduct independent analysis and maintain risk management practices.
开源脚本
秉承TradingView的精神,该脚本的作者将其开源,以便交易者可以查看和验证其功能。向作者致敬!您可以免费使用该脚本,但请记住,重新发布代码须遵守我们的网站规则。

Follow The Trend Not The Crowd
Free Telegram Channel
t.me/+M7U84ec7_HYxMjU0
Free Telegram Channel
t.me/+M7U84ec7_HYxMjU0
免责声明
这些信息和出版物并非旨在提供,也不构成TradingView提供或认可的任何形式的财务、投资、交易或其他类型的建议或推荐。请阅读使用条款了解更多信息。
开源脚本
秉承TradingView的精神,该脚本的作者将其开源,以便交易者可以查看和验证其功能。向作者致敬!您可以免费使用该脚本,但请记住,重新发布代码须遵守我们的网站规则。
Follow The Trend Not The Crowd
Free Telegram Channel
t.me/+M7U84ec7_HYxMjU0
Free Telegram Channel
t.me/+M7U84ec7_HYxMjU0
免责声明
这些信息和出版物并非旨在提供,也不构成TradingView提供或认可的任何形式的财务、投资、交易或其他类型的建议或推荐。请阅读使用条款了解更多信息。