MTF Minicharts + Triple EMA
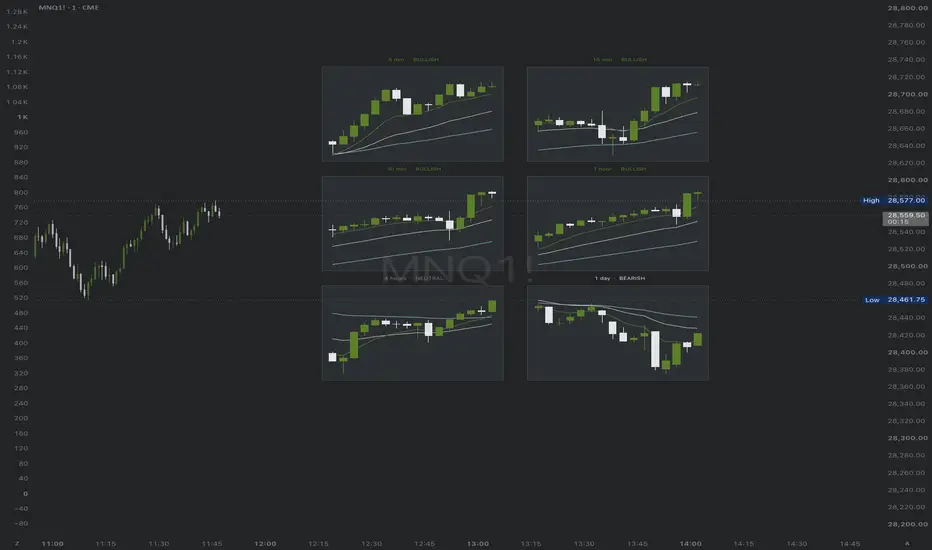
**MTF Minicharts + Triple EMA**
**Overview**
This indicator draws up to six small candlestick charts to the right of the last bar. Each one shows a different timeframe, so you can read the higher and lower timeframe structure without leaving your main chart. Each minichart includes its own 15/30/65 EMAs and a bias label, which lets you check trend alignment across timeframes at a glance.
**What makes it different**
Most multi-timeframe tools show higher-timeframe data as a table of values or as lines over the main chart. This script redraws real candles for each selected timeframe in a compact grid. It also computes the EMA stack and a directional bias separately for each timeframe, so every mini works as its own small chart instead of an overlay.
**How it works**
- For each selected timeframe, the script uses `request.security` to keep a rolling buffer of the last N candles (open, high, low, close) and that timeframe's 15, 30 and 65 period EMAs.
- Each mini is scaled to its own high and low over the visible window, including the EMAs when they're shown. Its height is set as a percentage of price.
- The newest candle in each mini is the one still forming on that timeframe, so it updates live.
**Bias modes**
- **EMA Stack:** Bullish when close is above EMA 15, EMA 15 is above EMA 30, and EMA 30 is above EMA 65 on the newest candle. Bearish when that order is fully reversed. Neutral otherwise.
- **Candle Close:** Bullish when the last closed candle closes above the previous candle's high, bearish when it closes below the previous candle's low, and neutral otherwise.
- An optional "Highlight Bias Candle" setting outlines the candle the bias was read from.
**How to use it**
- Pick up to six timeframes in "Minicharts Setup" and choose how many to show.
- Adjust the number of candles, bar spacing, chart height, column count, gaps and right offset under "Style & Layout" to fit your screen.
- "Sticky" position keeps the grid at a fixed price and bar location and only recenters it when price moves outside the grid or new bars reach it. "Follow Price" recenters it on every update.
- All candle, EMA, frame and bias colors can be changed.
**Notes and limitations**
- Pine Script draws in price and bar coordinates, so the minis scale with the chart when you zoom. Raise "Chart Height (%)" or "Bar Spacing" if they look compressed.
- The grid is drawn to the right of the last bar. Scroll right or lower "Right Offset" if part of it is cut off.
- Each timeframe's newest candle is still forming, so its values and the EMA Stack bias can change until that candle closes. Candle Close mode reads only closed candles.
- This is a visual analysis tool. It doesn't generate trade signals or alerts.
**Overview**
This indicator draws up to six small candlestick charts to the right of the last bar. Each one shows a different timeframe, so you can read the higher and lower timeframe structure without leaving your main chart. Each minichart includes its own 15/30/65 EMAs and a bias label, which lets you check trend alignment across timeframes at a glance.
**What makes it different**
Most multi-timeframe tools show higher-timeframe data as a table of values or as lines over the main chart. This script redraws real candles for each selected timeframe in a compact grid. It also computes the EMA stack and a directional bias separately for each timeframe, so every mini works as its own small chart instead of an overlay.
**How it works**
- For each selected timeframe, the script uses `request.security` to keep a rolling buffer of the last N candles (open, high, low, close) and that timeframe's 15, 30 and 65 period EMAs.
- Each mini is scaled to its own high and low over the visible window, including the EMAs when they're shown. Its height is set as a percentage of price.
- The newest candle in each mini is the one still forming on that timeframe, so it updates live.
**Bias modes**
- **EMA Stack:** Bullish when close is above EMA 15, EMA 15 is above EMA 30, and EMA 30 is above EMA 65 on the newest candle. Bearish when that order is fully reversed. Neutral otherwise.
- **Candle Close:** Bullish when the last closed candle closes above the previous candle's high, bearish when it closes below the previous candle's low, and neutral otherwise.
- An optional "Highlight Bias Candle" setting outlines the candle the bias was read from.
**How to use it**
- Pick up to six timeframes in "Minicharts Setup" and choose how many to show.
- Adjust the number of candles, bar spacing, chart height, column count, gaps and right offset under "Style & Layout" to fit your screen.
- "Sticky" position keeps the grid at a fixed price and bar location and only recenters it when price moves outside the grid or new bars reach it. "Follow Price" recenters it on every update.
- All candle, EMA, frame and bias colors can be changed.
**Notes and limitations**
- Pine Script draws in price and bar coordinates, so the minis scale with the chart when you zoom. Raise "Chart Height (%)" or "Bar Spacing" if they look compressed.
- The grid is drawn to the right of the last bar. Scroll right or lower "Right Offset" if part of it is cut off.
- Each timeframe's newest candle is still forming, so its values and the EMA Stack bias can change until that candle closes. Candle Close mode reads only closed candles.
- This is a visual analysis tool. It doesn't generate trade signals or alerts.

免责声明
这些信息和出版物并非旨在提供,也不构成TradingView提供或认可的任何形式的财务、投资、交易或其他类型的建议或推荐。请阅读使用条款了解更多信息。