OPEN-SOURCE SCRIPT
已更新 Fibonacci Active Timeframe Range [UkutaLabs]
█ OVERVIEW
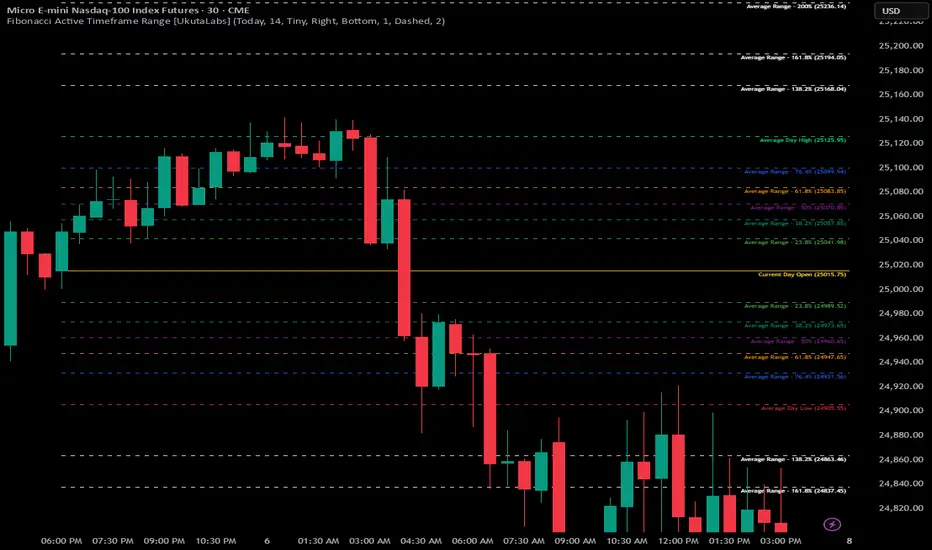
Fibonacci Active Timeframe Range is a precision intraday structure tool that uses real-time price expansion combined with Fibonacci ratios to map dynamic support and resistance levels directly from the active timeframe.
Rather than relying on fixed historical averages, this indicator continuously builds a live range from current price action, projecting Fibonacci-derived levels that adapt to market conditions as they develop.
The goal is to give traders a clear structural framework for:
—all in a clean, visual format that integrates seamlessly into any strategy or system.
█ USAGE
The indicator calculates the current timeframe range in real time, anchoring from the active session’s open and projecting multiple Fibonacci levels within that range.
These levels act as dynamic support and resistance zones, updating as price evolves — allowing traders to:
Each level is clearly labeled for instant recognition and can be used across scalping, intraday, and short-term swing strategies.
█ SETTINGS
Configuration
• Show Labels – Toggle labels on/off for a clean or informational view
• Display Mode – Control how much historical structure is visible
• Font Size – Adjust label size for readability
• Text Alignment – Align labels relative to each level
• Fibonacci Levels – Enable/disable specific ratios
• Range Mode – Select how the current timeframe range is calculated
Fibonacci Active Timeframe Range is a precision intraday structure tool that uses real-time price expansion combined with Fibonacci ratios to map dynamic support and resistance levels directly from the active timeframe.
Rather than relying on fixed historical averages, this indicator continuously builds a live range from current price action, projecting Fibonacci-derived levels that adapt to market conditions as they develop.
The goal is to give traders a clear structural framework for:
- Intraday bias
- Reaction zones
- Volatility expansion
- Pullback levels
- Continuation targets
—all in a clean, visual format that integrates seamlessly into any strategy or system.
█ USAGE
The indicator calculates the current timeframe range in real time, anchoring from the active session’s open and projecting multiple Fibonacci levels within that range.
These levels act as dynamic support and resistance zones, updating as price evolves — allowing traders to:
- Identify high-probability reaction areas
- Define structure for entries and exits
- Frame risk more precisely
- Align trades with real-time volatility
- Anticipate expansion and contraction phases
Each level is clearly labeled for instant recognition and can be used across scalping, intraday, and short-term swing strategies.
█ SETTINGS
Configuration
• Show Labels – Toggle labels on/off for a clean or informational view
• Display Mode – Control how much historical structure is visible
• Font Size – Adjust label size for readability
• Text Alignment – Align labels relative to each level
• Fibonacci Levels – Enable/disable specific ratios
• Range Mode – Select how the current timeframe range is calculated
版本注释
Extended lines by 2 bars to the right to allow for better visibility of levels.版本注释
Added an additional extension level at 200%版本注释
Added ability to customize the number of bars the line extends forward during market hoursAdded ability to customize the 'Current Day Open' line and label color
版本注释
Just cleaned up some code and reset default image版本注释
Just some general housekeeping and code cleanup版本注释
Incorporating the new UkutaLabs General Library into the code版本注释
Added new 'Vertical Alignment' option for labels开源脚本
秉承TradingView的精神,该脚本的作者将其开源,以便交易者可以查看和验证其功能。向作者致敬!您可以免费使用该脚本,但请记住,重新发布代码须遵守我们的网站规则。

免责声明
这些信息和出版物并非旨在提供,也不构成TradingView提供或认可的任何形式的财务、投资、交易或其他类型的建议或推荐。请阅读使用条款了解更多信息。
免责声明
这些信息和出版物并非旨在提供,也不构成TradingView提供或认可的任何形式的财务、投资、交易或其他类型的建议或推荐。请阅读使用条款了解更多信息。