OPEN-SOURCE SCRIPT
Trading Sessions + IB [midst]
What It Does
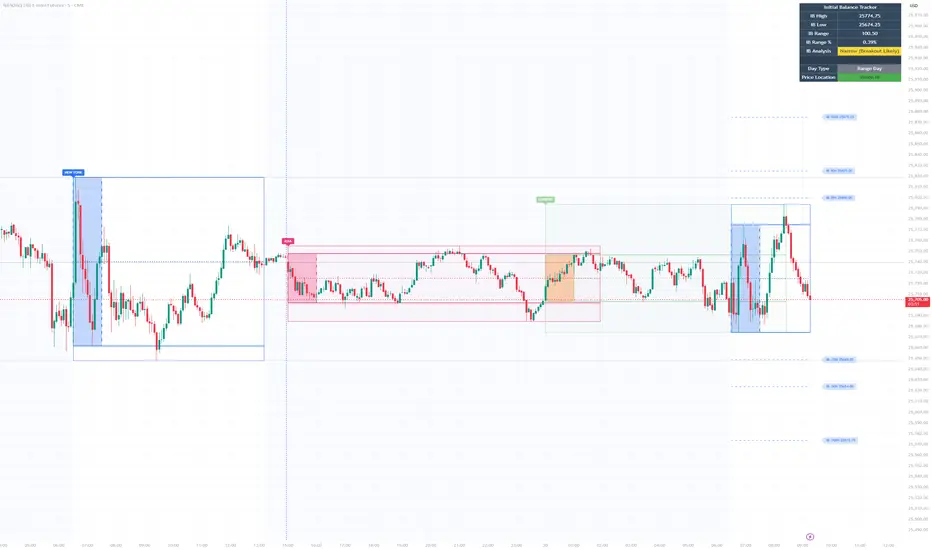
Displays the three major global trading sessions (Asia, London, New York) with Initial Balance (IB) ranges and extension levels. Automatically detects instrument type (ES, NQ, Gold, Silver) and applies correct IB period.
Key Features

Session Boxes: Visual high-to-low range for each session
Initial Balance: First 60 minutes of session range with IB high/mid/low lines
IB Extensions: Automatic calculation of +/-25%, 50%, 100% levels
Live IB Tracker: Real-time statistics table showing IB range, analysis, and market structure
Fully Customizable: Colors, line styles, labels, and display options
Why Use This
Identify key support/resistance levels based on session structure
Track IB breakouts for high-probability trade setups
Use extensions as profit targets or reversal zones
Compare session ranges to gauge volatility
Spot session overlaps for increased liquidity
Default Times (Chicago/Central Time)
Asia: 5:00 PM - 2:00 AM
London: 2:00 AM - 11:00 AM
New York: 7:30 AM - 4:00 PM
How To Use
Add indicator to your chart (works best on 5-15 minute timeframes)
Indicator auto-detects ES, NQ, GC, SI and applies correct 60-minute IB
Watch for price action at IB levels and extensions
Use IB Tracker table for real-time market analysis
Customization
Adjust everything: session times, IB period, colors, line styles, labels, table position. Toggle historical sessions, IB boxes, lines, extensions, and more.
Supported Instruments: ES/MES, NQ/MNQ, GC/MGC (Gold), SI (Silver) - auto-detection included
Displays the three major global trading sessions (Asia, London, New York) with Initial Balance (IB) ranges and extension levels. Automatically detects instrument type (ES, NQ, Gold, Silver) and applies correct IB period.
Key Features
Session Boxes: Visual high-to-low range for each session
Initial Balance: First 60 minutes of session range with IB high/mid/low lines
IB Extensions: Automatic calculation of +/-25%, 50%, 100% levels
Live IB Tracker: Real-time statistics table showing IB range, analysis, and market structure
Fully Customizable: Colors, line styles, labels, and display options
Why Use This
Identify key support/resistance levels based on session structure
Track IB breakouts for high-probability trade setups
Use extensions as profit targets or reversal zones
Compare session ranges to gauge volatility
Spot session overlaps for increased liquidity
Default Times (Chicago/Central Time)
Asia: 5:00 PM - 2:00 AM
London: 2:00 AM - 11:00 AM
New York: 7:30 AM - 4:00 PM
How To Use
Add indicator to your chart (works best on 5-15 minute timeframes)
Indicator auto-detects ES, NQ, GC, SI and applies correct 60-minute IB
Watch for price action at IB levels and extensions
Use IB Tracker table for real-time market analysis
Customization
Adjust everything: session times, IB period, colors, line styles, labels, table position. Toggle historical sessions, IB boxes, lines, extensions, and more.
Supported Instruments: ES/MES, NQ/MNQ, GC/MGC (Gold), SI (Silver) - auto-detection included
开源脚本
秉承TradingView的精神,该脚本的作者将其开源,以便交易者可以查看和验证其功能。向作者致敬!您可以免费使用该脚本,但请记住,重新发布代码须遵守我们的网站规则。

免责声明
这些信息和出版物并非旨在提供,也不构成TradingView提供或认可的任何形式的财务、投资、交易或其他类型的建议或推荐。请阅读使用条款了解更多信息。
免责声明
这些信息和出版物并非旨在提供,也不构成TradingView提供或认可的任何形式的财务、投资、交易或其他类型的建议或推荐。请阅读使用条款了解更多信息。