OPEN-SOURCE SCRIPT
Dynamic Support & Resistance V3
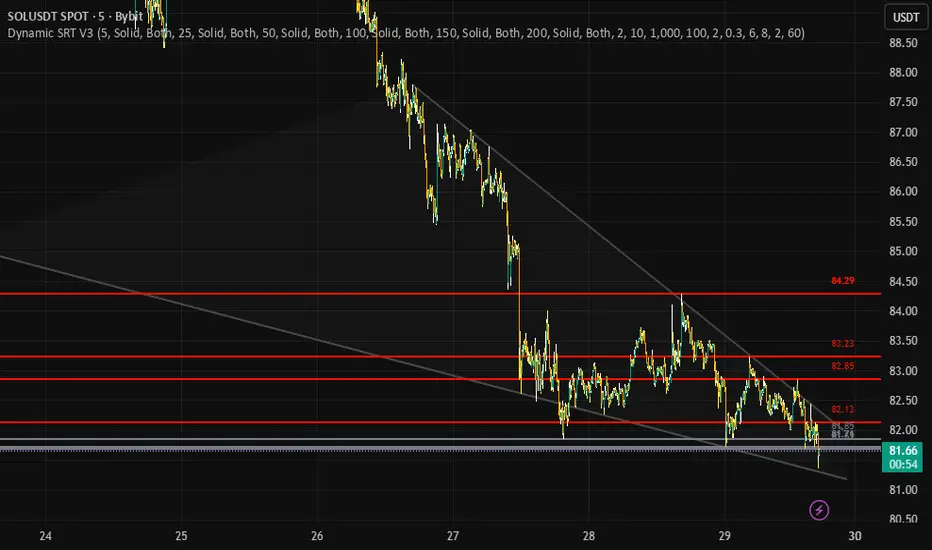
Dynamic SRT V3 by Anonycryptous inspired by Ilja V.
Compared to the previous version, a completely new and accelerated concept.
Dynamic SRT V3 is a professional structural mapping suite that identifies high-density liquidity zones through a dual-engine calculation process. By merging a 6-Tiered Pivot Architecture with a Validated Diagonal Scoring Engine, it provides a surgical view of market boundaries, allowing traders to distinguish between minor price fluctuations and major institutional walls.
*How the Engine Operates
This indicator functions as a mathematical filter for price action, operating on two distinct layers:
-1. Tiered Institutional Anchors (Horizontal)
Instead of looking at a single fractal period, V3 tracks six different "memory depths" simultaneously (ranging from 5 to 200 bars).
The Concept: Markets move in cycles. Small cycles (Pivot 1-2) represent retail positioning, while large cycles (Pivot 5-6) represent institutional buy/sell walls.
State-Aware Logic: Each level uses an ATR-Volatility Buffer to determine its current state. If price is above the level, it acts as Support (Green); if below, it is Resistance (Red). If price is currently slicing through it, the level turns Grey (Neutral), signaling a "No-Trade Zone" or a consolidation phase.
-2. Slope-Intercept Validation Engine (Diagonal)
The dynamic trendlines are not just simple "peak-to-peak" connectors. They are calculated using a Linear Regression Scoring System.
*The Concept: A trendline's strength is defined by its "cleanliness."
-The Filter: Unlike standard tools, V3 uses a Price-Action Scan. It calculates the path of a potential trendline and automatically discards it if it cuts through the bodies of intermediate candles. This ensures that the wedges and channels you see are statistically valid structural boundaries.
-Strategic Application: LTF vs. HTF
*Performance & User Manual
-Optimized Execution: V3 utilizes Last-Bar Offloading. It scans 1000+ bars of history in milliseconds by executing the heavy diagonal math only on the most recent candle, ensuring zero chart lag.
-Price Tags: Dynamic labels are pinned professionally above the levels. Use these as your Take-Profit (TP) or Stop-Loss (SL) targets.
-Customization: Adjust the Touch Tolerance in the settings to make the trendlines more or less strict depending on the asset's "wickiness" (e.g., higher for BTC, lower for Forex).
*Lower Timeframes (1m – 15m): Scalping & Intraday
-LTF Focus: Prioritize Pivot Levels 1, 2, and 3. These are highly reactive and will map the micro-pullbacks of the current session.
-Early Signal: Look for price to reject a Dynamic Trendline while a micro-pivot (Level 1) is acting as support. This provides an aggressive "Early Entry" with a very tight risk-to-reward ratio.
-The Trap: Avoid trading when the LTF candles are consistently Grey, as this indicates the market is trapped inside a static pivot zone.
-Higher Timeframes (1H – Daily): Swing & Position Trading
*HTF Focus: Prioritize Pivot Levels 5 and 6. These represent the "Major Floors and Ceilings" of the weekly or monthly trend.
-The Macro Wall: If price hits a Level 6 Pivot (200-bar lookback), expect a significant reaction. Institutional orders are often clustered at these depths.
-Structural Confluence: The most powerful HTF setup is "The Confluence Cross." This occurs when a diagonal Resistance Trendline and a horizontal Level 5/6 Resistance meet at the same price point. This is the mathematical "End of Trend" zone where heavy reversals typically begin.
! Notice: This tool is for institutional-grade structural mapping and educational purposes only. It is not financial advice. Structural levels are areas of high probability, not guaranteed reversal points. Always trade with a stop-loss.
Compared to the previous version, a completely new and accelerated concept.
Dynamic SRT V3 is a professional structural mapping suite that identifies high-density liquidity zones through a dual-engine calculation process. By merging a 6-Tiered Pivot Architecture with a Validated Diagonal Scoring Engine, it provides a surgical view of market boundaries, allowing traders to distinguish between minor price fluctuations and major institutional walls.
*How the Engine Operates
This indicator functions as a mathematical filter for price action, operating on two distinct layers:
-1. Tiered Institutional Anchors (Horizontal)
Instead of looking at a single fractal period, V3 tracks six different "memory depths" simultaneously (ranging from 5 to 200 bars).
The Concept: Markets move in cycles. Small cycles (Pivot 1-2) represent retail positioning, while large cycles (Pivot 5-6) represent institutional buy/sell walls.
State-Aware Logic: Each level uses an ATR-Volatility Buffer to determine its current state. If price is above the level, it acts as Support (Green); if below, it is Resistance (Red). If price is currently slicing through it, the level turns Grey (Neutral), signaling a "No-Trade Zone" or a consolidation phase.
-2. Slope-Intercept Validation Engine (Diagonal)
The dynamic trendlines are not just simple "peak-to-peak" connectors. They are calculated using a Linear Regression Scoring System.
*The Concept: A trendline's strength is defined by its "cleanliness."
-The Filter: Unlike standard tools, V3 uses a Price-Action Scan. It calculates the path of a potential trendline and automatically discards it if it cuts through the bodies of intermediate candles. This ensures that the wedges and channels you see are statistically valid structural boundaries.
-Strategic Application: LTF vs. HTF
*Performance & User Manual
-Optimized Execution: V3 utilizes Last-Bar Offloading. It scans 1000+ bars of history in milliseconds by executing the heavy diagonal math only on the most recent candle, ensuring zero chart lag.
-Price Tags: Dynamic labels are pinned professionally above the levels. Use these as your Take-Profit (TP) or Stop-Loss (SL) targets.
-Customization: Adjust the Touch Tolerance in the settings to make the trendlines more or less strict depending on the asset's "wickiness" (e.g., higher for BTC, lower for Forex).
*Lower Timeframes (1m – 15m): Scalping & Intraday
-LTF Focus: Prioritize Pivot Levels 1, 2, and 3. These are highly reactive and will map the micro-pullbacks of the current session.
-Early Signal: Look for price to reject a Dynamic Trendline while a micro-pivot (Level 1) is acting as support. This provides an aggressive "Early Entry" with a very tight risk-to-reward ratio.
-The Trap: Avoid trading when the LTF candles are consistently Grey, as this indicates the market is trapped inside a static pivot zone.
-Higher Timeframes (1H – Daily): Swing & Position Trading
*HTF Focus: Prioritize Pivot Levels 5 and 6. These represent the "Major Floors and Ceilings" of the weekly or monthly trend.
-The Macro Wall: If price hits a Level 6 Pivot (200-bar lookback), expect a significant reaction. Institutional orders are often clustered at these depths.
-Structural Confluence: The most powerful HTF setup is "The Confluence Cross." This occurs when a diagonal Resistance Trendline and a horizontal Level 5/6 Resistance meet at the same price point. This is the mathematical "End of Trend" zone where heavy reversals typically begin.
! Notice: This tool is for institutional-grade structural mapping and educational purposes only. It is not financial advice. Structural levels are areas of high probability, not guaranteed reversal points. Always trade with a stop-loss.
开源脚本
秉承TradingView的精神,该脚本的作者将其开源,以便交易者可以查看和验证其功能。向作者致敬!您可以免费使用该脚本,但请记住,重新发布代码须遵守我们的网站规则。

免责声明
这些信息和出版物并非旨在提供,也不构成TradingView提供或认可的任何形式的财务、投资、交易或其他类型的建议或推荐。请阅读使用条款了解更多信息。
开源脚本
秉承TradingView的精神,该脚本的作者将其开源,以便交易者可以查看和验证其功能。向作者致敬!您可以免费使用该脚本,但请记住,重新发布代码须遵守我们的网站规则。
免责声明
这些信息和出版物并非旨在提供,也不构成TradingView提供或认可的任何形式的财务、投资、交易或其他类型的建议或推荐。请阅读使用条款了解更多信息。