已更新
Mr Oatto US Stock Hunter
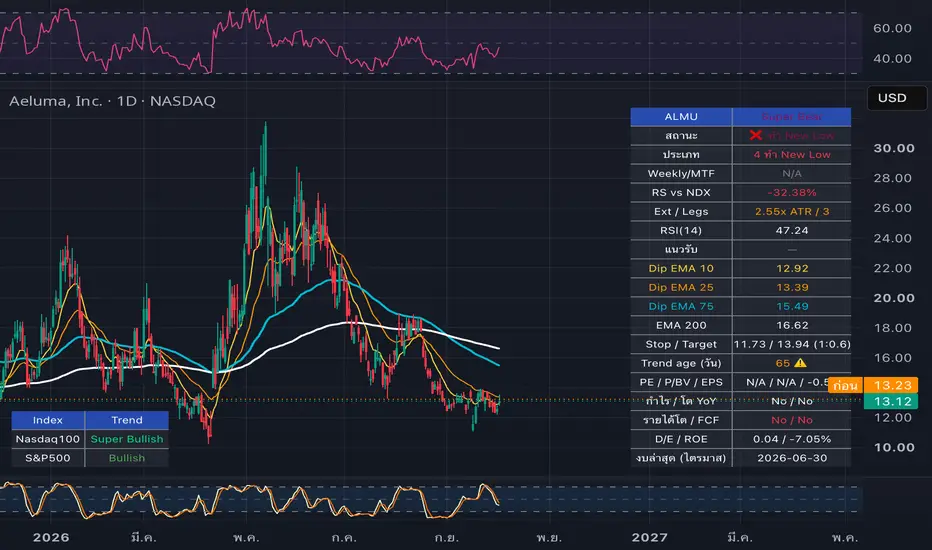
**Mr Oatto Runtrend Stock — Daily-Anchored Trend & Pullback Analyzer**
A trend-following / swing-trading toolkit built around a 5-EMA ribbon (5/15/35/89/200), designed to answer one question whenever you open any symbol: *is this a good time to run the trend, or should I wait for a pullback?*
**Why "Daily-anchored"?**
Every analytical metric in this script (trend classification, trade-ready status, ATR stop/target, extension, swing-leg count, trend age, and relative strength) is computed on the Daily timeframe internally via `request.security`, regardless of which chart timeframe you currently have open. This means the numbers stay consistent whether you're looking at a 1H, 4H, or Weekly chart. Only the plotted EMA lines on the chart follow your current chart resolution, so the visual stays clean and relevant to whatever timeframe you're zoomed into.
**Key Features**
- **EMA Trend Classification** — Super Bullish / Bullish / Sideway Up / Sideway Down / Downtrend / Super Bear, based on EMA stack alignment (Daily).
- **Weekly MTF Filter** — confirms whether the Daily trend aligns with the Weekly trend (higher-timeframe confirmation).
- **Relative Strength vs SET Index** — measures whether the stock is outperforming or underperforming the SET index over the same Daily lookback window.
- **Chase-Risk Filter** — flags when price has already run too far from the EMA35 (in ATR multiples or %) or has formed too many swing legs since the trend began, switching the recommendation from "ready to run the trend" to "wait for a pullback" instead of chasing an extended move.
- **Swing-Leg Counter** — a simplified pivot-based proxy for "how many legs has this move made." This is NOT a true Elliott Wave count. Automated Elliott Wave labeling is inherently subjective and unreliable; this feature is intentionally a rough heuristic, not a wave-count claim.
- **ATR-Based Stop/Target** — suggested stop-loss and take-profit levels sized by Daily ATR, with a configurable reward:risk ratio.
- **Trend Age / Overextension Warning** — flags when the current trend regime has persisted unusually long.
- **Fundamentals Snapshot** — PE ratio, profitability, and YoY earnings growth for the symbol on your chart.
- **Market Overview** — SET / SET50 / SET100 index trend at a glance.
- **Built-in Alerts** — trend flips, cut warnings, overextension, chase-risk, and pullback-entry signals.
- **Three independent panels** (Trend / Edge Metrics / Market) that can each be repositioned and resized independently to avoid overlap on your chart.
**How to Read It**
1. Check the **Trend Panel** (bottom-right by default) for the overall Trade Status — this is the quick answer.
2. Check the **Edge Panel** (bottom-left by default) for the reasoning behind that status: Weekly alignment, relative strength, extension, swing legs, and suggested risk levels.
3. Check the **Market Panel** (top-right by default) for the broader SET market context.
**Settings**
All EMA periods, ATR multipliers, extension thresholds, swing-pivot sensitivity, and panel positions/text size are configurable via the indicator settings, organized into logical groups.
**Disclaimer**
This script is for educational and informational purposes only. It does not constitute financial advice, and past trend behavior does not guarantee future results. The swing-leg counter is a simplified heuristic, not a validated Elliott Wave count. Always apply your own risk management and position sizing. Trade at your own risk.
A trend-following / swing-trading toolkit built around a 5-EMA ribbon (5/15/35/89/200), designed to answer one question whenever you open any symbol: *is this a good time to run the trend, or should I wait for a pullback?*
**Why "Daily-anchored"?**
Every analytical metric in this script (trend classification, trade-ready status, ATR stop/target, extension, swing-leg count, trend age, and relative strength) is computed on the Daily timeframe internally via `request.security`, regardless of which chart timeframe you currently have open. This means the numbers stay consistent whether you're looking at a 1H, 4H, or Weekly chart. Only the plotted EMA lines on the chart follow your current chart resolution, so the visual stays clean and relevant to whatever timeframe you're zoomed into.
**Key Features**
- **EMA Trend Classification** — Super Bullish / Bullish / Sideway Up / Sideway Down / Downtrend / Super Bear, based on EMA stack alignment (Daily).
- **Weekly MTF Filter** — confirms whether the Daily trend aligns with the Weekly trend (higher-timeframe confirmation).
- **Relative Strength vs SET Index** — measures whether the stock is outperforming or underperforming the SET index over the same Daily lookback window.
- **Chase-Risk Filter** — flags when price has already run too far from the EMA35 (in ATR multiples or %) or has formed too many swing legs since the trend began, switching the recommendation from "ready to run the trend" to "wait for a pullback" instead of chasing an extended move.
- **Swing-Leg Counter** — a simplified pivot-based proxy for "how many legs has this move made." This is NOT a true Elliott Wave count. Automated Elliott Wave labeling is inherently subjective and unreliable; this feature is intentionally a rough heuristic, not a wave-count claim.
- **ATR-Based Stop/Target** — suggested stop-loss and take-profit levels sized by Daily ATR, with a configurable reward:risk ratio.
- **Trend Age / Overextension Warning** — flags when the current trend regime has persisted unusually long.
- **Fundamentals Snapshot** — PE ratio, profitability, and YoY earnings growth for the symbol on your chart.
- **Market Overview** — SET / SET50 / SET100 index trend at a glance.
- **Built-in Alerts** — trend flips, cut warnings, overextension, chase-risk, and pullback-entry signals.
- **Three independent panels** (Trend / Edge Metrics / Market) that can each be repositioned and resized independently to avoid overlap on your chart.
**How to Read It**
1. Check the **Trend Panel** (bottom-right by default) for the overall Trade Status — this is the quick answer.
2. Check the **Edge Panel** (bottom-left by default) for the reasoning behind that status: Weekly alignment, relative strength, extension, swing legs, and suggested risk levels.
3. Check the **Market Panel** (top-right by default) for the broader SET market context.
**Settings**
All EMA periods, ATR multipliers, extension thresholds, swing-pivot sensitivity, and panel positions/text size are configurable via the indicator settings, organized into logical groups.
**Disclaimer**
This script is for educational and informational purposes only. It does not constitute financial advice, and past trend behavior does not guarantee future results. The swing-leg counter is a simplified heuristic, not a validated Elliott Wave count. Always apply your own risk management and position sizing. Trade at your own risk.
版本注释
Update Corrected Trend analysis 版本注释
**Mr Oatto US Stock Hunter: changelog****Major update**
- Rebuilt on the Runtrend engine, with EMA values kept at 10 / 25 / 75 / 75 / 200.
- Added stock classification into four types (1 strong uptrend, 2 reversal, 3 downtrend losing momentum, 4 new low / avoid) plus a neutral type 0.
- Added an RSI(14) support-zone rule: support moves from EMA 10/25 to EMA 75 when RSI breaks 50, then to EMA 200 if price closes below EMA 75.
- Added Stop and Target. Stop sits below the active EMA support with an ATR buffer. Target is the last confirmed swing high above price, with a 1:2 fallback. The dashboard shows the achieved reward-to-risk ratio.
- Added a trade status row with clearer labels: Long, Short, Wait for Pullback, Caution, Avoid, Watch, Reversal Confirm Above 200, and Cut First.
- Added Chase Risk, which flags extension from EMA 75, overextended trends, and late-stage swing counts. These change the status to Wait for Pullback.
- Added a weekly trend filter (Daily vs Weekly alignment) and relative strength versus Nasdaq100.
**Fundamentals (quarterly)**
- PE, P/BV (estimated), EPS, profit and YoY growth, revenue growth, free cash flow, debt-to-equity, ROE, and the latest report date.
- P/BV and ROE are estimates. ROE uses quarterly earnings, so it is not annualized.
**Layout**
- Replaced the three separate panels with one dashboard plus one market table to avoid overlap.
- The market table shows Nasdaq100 and S&P500 trends and now defaults to the bottom-left corner.
- The dashboard defaults to the bottom-right corner.
- If EMA Slow and EMA Filter are set to the same value, the dashboard shows one "Dip EMA" row instead of two identical rows.
**Alerts (9 total)**
- Trend Turned Bullish
- Trend Turned Bearish
- Cut Warning
- Trend Overextended
- Chase Risk: Wait for Pullback
- RSI Broke 50: Support Shift
- Reversal Type 2 Entered
- New Low: Avoid
- Pullback Entry Signal
**Before you publish**
- The file compiled cleanly before the last two edits (the default market table position and the duplicate EMA row). Compile it once more in the Pine Editor before publishing.
- It has not been tested on a live US chart yet. Check the dashboard on a phone-sized screen before you publish.
- The header comment in the file still says the dashboard has "not more than 13 rows". That is out of date, and I can fix it if you want.

免责声明
这些信息和出版物并非旨在提供,也不构成TradingView提供或认可的任何形式的财务、投资、交易或其他类型的建议或推荐。请阅读使用条款了解更多信息。