daily highs and lows
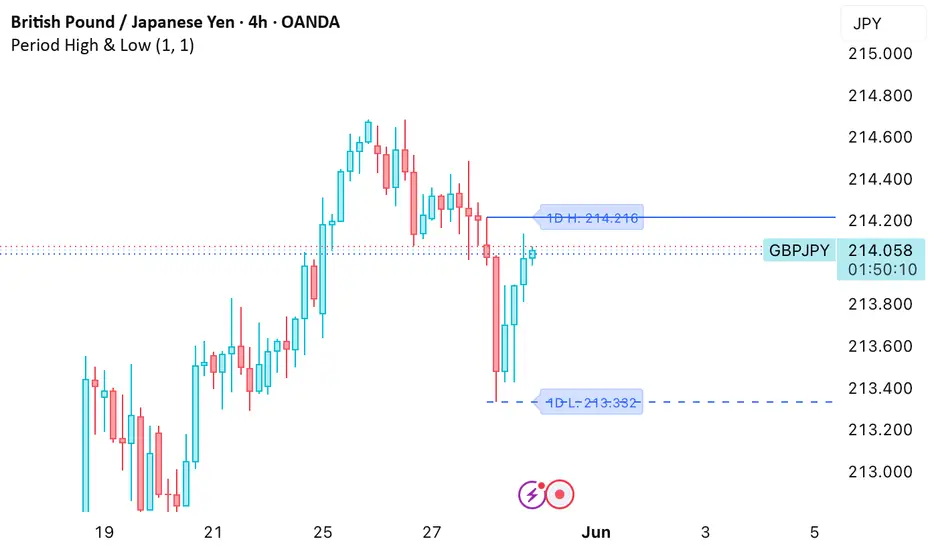
Here's a clean, simple description:
Plots the highest high and lowest low over a set number of days directly on your chart. Useful for quickly spotting key support and resistance levels without any clutter.
Settings:
Days — how far back to look
Color — line color
Line Width — thickness of the lines
Show Labels — toggle the H/L labels on or off
Extend Right — extends the lines to the right of the chart
Solid line is the high, dashed line is the low.
Plots the highest high and lowest low over a set number of days directly on your chart. Useful for quickly spotting key support and resistance levels without any clutter.
Settings:
Days — how far back to look
Color — line color
Line Width — thickness of the lines
Show Labels — toggle the H/L labels on or off
Extend Right — extends the lines to the right of the chart
Solid line is the high, dashed line is the low.

免责声明
这些信息和出版物并非旨在提供,也不构成TradingView提供或认可的任何形式的财务、投资、交易或其他类型的建议或推荐。请阅读使用条款了解更多信息。
免责声明
这些信息和出版物并非旨在提供,也不构成TradingView提供或认可的任何形式的财务、投资、交易或其他类型的建议或推荐。请阅读使用条款了解更多信息。