OPEN-SOURCE SCRIPT
PnL Target/Stop Calculator $100 - $2000
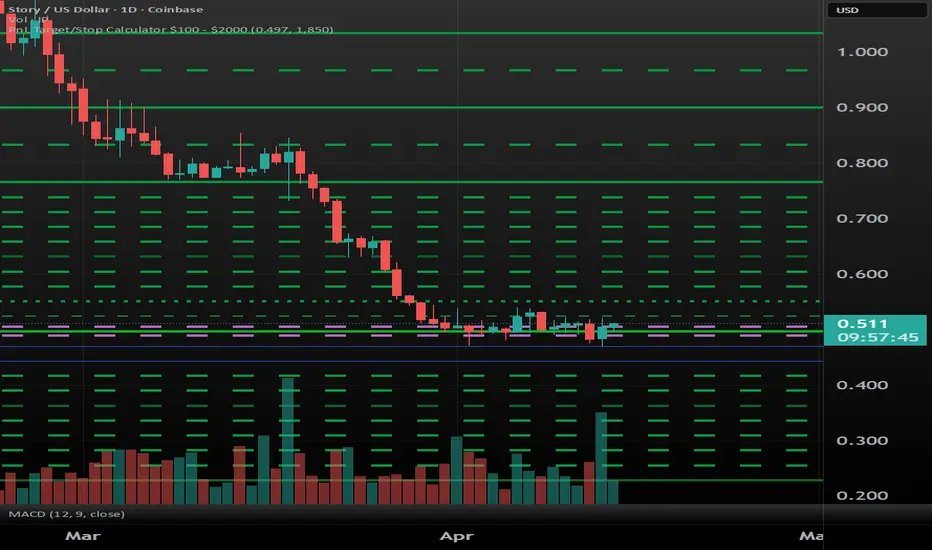
This tool plots gains and losses in $100 increments from $100 - $2000.
This can be used to find stop losses and targets based on PnL or to find the price where a specific loss or gain will occur at, and this is shown visually on chart with horizontal lines.
The user must define 2 values: The average entry price and how much is invested. This is done by going into the indicator's settings and clicking the Input tab.
Both entry and cash amount are used to determine where $100 increments of gain and loss are.
What's displayed?
- The brightest solid green line shows your entry.
- The skinniest dashed green line shows $100 loss/gain.
- The dotted green line shows $200 loss gain.
- It also contains a 1.6% stop, shown by the dashed purple lines.
- Solid green lines are $1000, $1500, and $2000.
After $1000 gain, the indicator shows gain in $250 increments up until $2000.
While PnL loss only goes up to $1000.
Here is how this is calculated:
$100 loss = [ (1-(100/cash)) * entry ].
$100 gain = [ (1+(100/cash)) * entry ]
$200 loss = [ (1-(200/cash)) * entry ].
$200 gain = [ (1+(200/cash)) * entry ]
...And so on.
To keep the horizontal lines after the indicator is removed, draw a horizontal ray or a horizontal line where the lines are drawn by the indicator and then remove the indicator after drawing the lines you wanted.
This can be used to find stop losses and targets based on PnL or to find the price where a specific loss or gain will occur at, and this is shown visually on chart with horizontal lines.
The user must define 2 values: The average entry price and how much is invested. This is done by going into the indicator's settings and clicking the Input tab.
Both entry and cash amount are used to determine where $100 increments of gain and loss are.
What's displayed?
- The brightest solid green line shows your entry.
- The skinniest dashed green line shows $100 loss/gain.
- The dotted green line shows $200 loss gain.
- It also contains a 1.6% stop, shown by the dashed purple lines.
- Solid green lines are $1000, $1500, and $2000.
After $1000 gain, the indicator shows gain in $250 increments up until $2000.
While PnL loss only goes up to $1000.
Here is how this is calculated:
$100 loss = [ (1-(100/cash)) * entry ].
$100 gain = [ (1+(100/cash)) * entry ]
$200 loss = [ (1-(200/cash)) * entry ].
$200 gain = [ (1+(200/cash)) * entry ]
...And so on.
To keep the horizontal lines after the indicator is removed, draw a horizontal ray or a horizontal line where the lines are drawn by the indicator and then remove the indicator after drawing the lines you wanted.
开源脚本
秉承TradingView的精神,该脚本的作者将其开源,以便交易者可以查看和验证其功能。向作者致敬!您可以免费使用该脚本,但请记住,重新发布代码须遵守我们的网站规则。

免责声明
这些信息和出版物并非旨在提供,也不构成TradingView提供或认可的任何形式的财务、投资、交易或其他类型的建议或推荐。请阅读使用条款了解更多信息。
开源脚本
秉承TradingView的精神,该脚本的作者将其开源,以便交易者可以查看和验证其功能。向作者致敬!您可以免费使用该脚本,但请记住,重新发布代码须遵守我们的网站规则。
免责声明
这些信息和出版物并非旨在提供,也不构成TradingView提供或认可的任何形式的财务、投资、交易或其他类型的建议或推荐。请阅读使用条款了解更多信息。