OPEN-SOURCE SCRIPT
AK - DCA Calculator
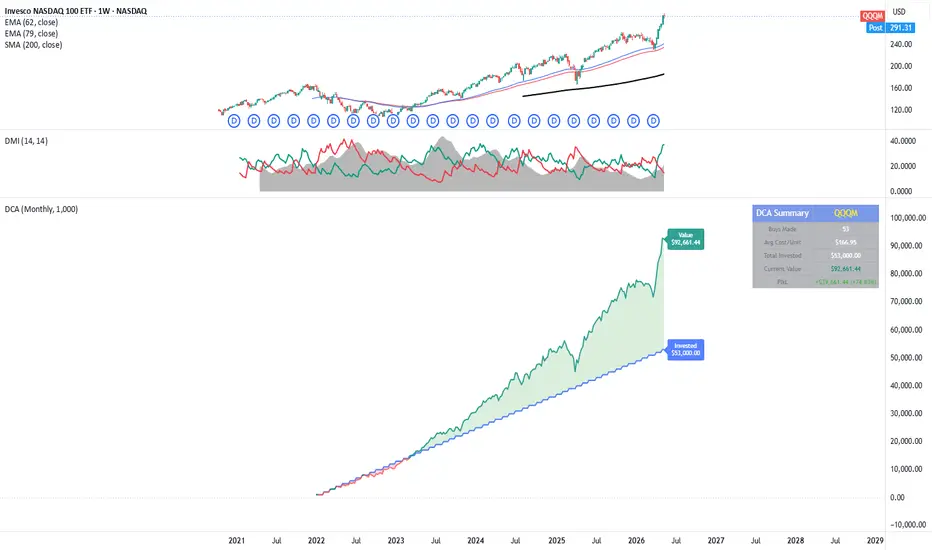
This indicator visualizes your Dollar Cost Averaging (DCA) strategy directly on your chart — no backtesting, no strategy tester, just a clean plot showing exactly where your money stands today.
What it does
Set your start date, buy frequency, and investment amount — the indicator calculates how many units you would have accumulated through consistent DCA purchases, then plots your total invested capital against your current portfolio value in a separate pane below the chart.
Features
📅 Configurable start date — model your DCA from any point in history
🔁 Three buy frequencies — Daily, Weekly, or Monthly
💵 Custom investment amount per purchase
📊 Separate pane — does not clutter your main price chart
🟢 Green fill when you're in profit, red fill when underwater
🏷️ Live labels on the last bar showing exact invested vs. current value
📋 Summary table (top-right) showing: buys made, average cost per unit, total invested, current portfolio value, and P&L in both $ and %
🎨 Fully customizable colors for all plot elements
How to use
Add the indicator to any ticker
Open Settings and set your Start Date, Buy Frequency, and Amount per Purchase
Best used on a Daily or Weekly chart for accurate frequency simulation
Works on any asset — stocks, crypto, forex, indices.
What it does
Set your start date, buy frequency, and investment amount — the indicator calculates how many units you would have accumulated through consistent DCA purchases, then plots your total invested capital against your current portfolio value in a separate pane below the chart.
Features
📅 Configurable start date — model your DCA from any point in history
🔁 Three buy frequencies — Daily, Weekly, or Monthly
💵 Custom investment amount per purchase
📊 Separate pane — does not clutter your main price chart
🟢 Green fill when you're in profit, red fill when underwater
🏷️ Live labels on the last bar showing exact invested vs. current value
📋 Summary table (top-right) showing: buys made, average cost per unit, total invested, current portfolio value, and P&L in both $ and %
🎨 Fully customizable colors for all plot elements
How to use
Add the indicator to any ticker
Open Settings and set your Start Date, Buy Frequency, and Amount per Purchase
Best used on a Daily or Weekly chart for accurate frequency simulation
Works on any asset — stocks, crypto, forex, indices.
开源脚本
秉承TradingView的精神,该脚本的作者将其开源,以便交易者可以查看和验证其功能。向作者致敬!您可以免费使用该脚本,但请记住,重新发布代码须遵守我们的网站规则。

免责声明
这些信息和出版物并非旨在提供,也不构成TradingView提供或认可的任何形式的财务、投资、交易或其他类型的建议或推荐。请阅读使用条款了解更多信息。
开源脚本
秉承TradingView的精神,该脚本的作者将其开源,以便交易者可以查看和验证其功能。向作者致敬!您可以免费使用该脚本,但请记住,重新发布代码须遵守我们的网站规则。
免责声明
这些信息和出版物并非旨在提供,也不构成TradingView提供或认可的任何形式的财务、投资、交易或其他类型的建议或推荐。请阅读使用条款了解更多信息。