TEWMA Trend Strength - [JTCAPITAL]
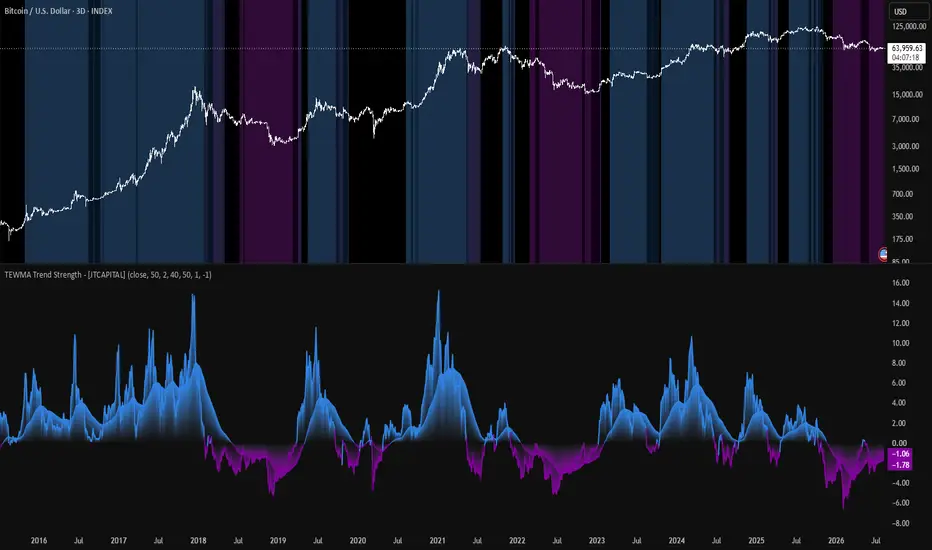
TEWMA Trend Strength - [JTCAPITAL] is a modified way to use Triple Exponentially Weighted Moving Averages (TEMA), Weighted Moving Averages (WMA), Average True Range (ATR), and EMA smoothing to measure the strength and direction of a trend.
Instead of simply determining whether price is above or below a single moving average, the indicator measures how far the current closing price is positioned from a composite trend baseline and normalizes that distance by market volatility using ATR. This produces a dimensionless trend-strength value that can be compared across different volatility environments.
The indicator combines two independently calculated TEWMA structures using different lengths. The first TEWMA is built from the selected source using the primary length, while the second uses a longer dynamically calculated length. These two TEWMA values are then averaged into one composite baseline.
The resulting distance between price and this composite baseline is divided by ATR. This normalization is important because a fixed price distance does not have the same meaning in every market or volatility regime. A move of 500 points can be extremely significant during a quiet market while being relatively insignificant during a highly volatile market. By measuring the distance relative to ATR, the indicator expresses the displacement in terms of the market's recent typical movement range.
A second, EMA-smoothed version of this strength measurement is also calculated. This provides a slower representation of the underlying trend-strength state while the raw strength value remains more responsive to current price movement.
The result is an oscillator designed to show both trend direction and relative trend strength in a single framework.
The indicator works by calculating in the following steps:
Buy and Sell Conditions:
This indicator does not contain explicit buy or sell conditions, entries, exits, alerts, or trade execution logic.
Instead, it is designed as a trend-strength oscillator.
The primary directional interpretation comes from the zero line:
* When the raw strength is above 0, price is above the composite TEWMA.
* When the raw strength is below 0, price is below the composite TEWMA.
* When the smoothed strength is above 0, the smoothed trend-strength state is positive.
* When the smoothed strength is below 0, the smoothed trend-strength state is negative.
The upper and lower thresholds provide an additional measurement of the magnitude of the normalized displacement:
* Strength above the upper threshold indicates that price is positioned more than the selected positive ATR multiple above the composite TEWMA.
* Strength below the lower threshold indicates that price is positioned more than the selected negative ATR multiple below the composite TEWMA.
The smoothed line can be used to observe whether the broader strength condition agrees with the raw strength measurement.
For example, a user may choose to interpret a positive raw strength together with positive smoothed strength as stronger directional alignment than a positive raw strength value occurring while the smoothed measurement remains negative.
However, these are interpretations of the indicator's measurements rather than coded buy or sell rules. The script itself does not automatically define a trade entry simply because one of these conditions occurs.
This distinction is important because the indicator measures market structure and normalized trend strength rather than providing a complete trading strategy.
Features and Parameters:
* Source - Selects the price series used as the input for the WMA calculations. The default source is Close.
* Length - Defines the primary length used for the first WMA and TEMA calculation. The default value is 50.
* Multiplier - Multiplies the primary length to determine the second TEWMA length. The default value is 2. With a Length of 50, this produces a second length of 100.
* ATR Length - Determines the period used to calculate ATR for volatility normalization. The default value is 40.
* Smoothing Length - Determines the EMA period used to smooth the raw strength measurement. The default value is 50.
* Upper - Defines the positive normalized-strength threshold used for the bullish background condition. The default value is 1.
* Lower - Defines the negative normalized-strength threshold used for the bearish background condition. The default value is -1.
* Raw Strength - Displays the current ATR-normalized distance between closing price and the composite TEWMA.
* Smoothed Strength - Displays an EMA-smoothed version of the raw strength measurement.
* Zero Line - Represents the point where closing price is equal to the composite TEWMA.
* Threshold Backgrounds - Visually highlights situations where raw or smoothed strength exceeds the configured upper or lower thresholds.
Specifications:
Weighted Moving Average (WMA)
The Weighted Moving Average is a moving average that assigns different weights to the observations within its calculation period.
More recent values receive greater influence than older values.
Compared with a Simple Moving Average, which gives every observation the same weight, WMA emphasizes the more recent portion of the selected price history.
In this indicator, WMA is used as the first smoothing stage before the data enters the TEMA calculation.
This creates a smoother input for TEMA while retaining greater responsiveness to recent price changes than an equally weighted average.
Triple Exponential Moving Average (TEMA)
Triple Exponential Moving Average is a multi-stage exponential smoothing method designed to reduce the lag that can occur with conventional moving averages.
The underlying calculation uses three consecutive EMA stages:
EMA1 = EMA(Input)
EMA2 = EMA(EMA1)
EMA3 = EMA(EMA2)
These are combined approximately as:
TEMA = 3 × EMA1 - 3 × EMA2 + EMA3
The mathematical combination attempts to compensate for some of the lag introduced by repeated exponential smoothing.
In this indicator, TEMA is applied after WMA rather than directly to price.
This creates the specific structure:
Selected Source → WMA → TEMA
That combination is the basis of the indicator's TEWMA concept.
TEWMA
TEWMA in this script refers to the combination of a Weighted Moving Average and a Triple Exponential Moving Average.
Each TEWMA component is therefore produced through a WMA followed by TEMA.
The script creates two separate TEWMA values using different lengths.
The first uses the primary length.
The second uses the primary length multiplied by the user-defined multiplier.
The two resulting values are then averaged.
This gives the final baseline a combination of a faster and slower trend perspective.
Dual-Length TEWMA Structure
The indicator does not rely on a single TEWMA.
Instead, it calculates:
TEWMA1 = TEMA(WMA(Source, Length), Length)
and:
TEWMA2 = TEMA(WMA(Source, Length2), Length2)
where:
Length2 = round(Length × Multiplier)
The two values are then averaged.
This is important because a single moving-average length represents only one smoothing horizon.
The dual-length structure allows the composite baseline to incorporate both a more responsive trend component and a slower trend component.
The averaging process creates a single reference value from those two perspectives.
Composite TEWMA
The final TEWMA is calculated as:
TEWMA = average(TEWMA1, TEWMA2)
or mathematically:
TEWMA = (TEWMA1 + TEWMA2) / 2
This composite value acts as the central trend baseline of the entire indicator.
Every raw strength value is calculated relative to this baseline.
Therefore, the TEWMA is not simply plotted as a moving average for visual reference; it directly determines the numerator of the strength calculation.
Average True Range (ATR)
Average True Range is a volatility measurement that estimates the typical trading range of the market over a selected period.
It is based on True Range, which accounts for both the current candle's high-low range and gaps relative to the previous closing price.
The ATR is used here as a normalization factor.
This is a critical part of the indicator because the raw distance between price and TEWMA is not directly comparable across different volatility conditions.
Dividing the price displacement by ATR expresses the distance in volatility-adjusted terms.
The resulting value can therefore be interpreted as the approximate number of ATR units that price is positioned above or below the composite TEWMA.
ATR Normalization
The core normalization is:
(Close - TEWMA) / ATR
The numerator determines direction and absolute displacement.
The denominator determines the scale of the market's recent volatility.
This combination allows the indicator to transform a raw price difference into a normalized strength measurement.
A positive result means price is above the TEWMA.
A negative result means price is below the TEWMA.
The magnitude indicates how large that displacement is relative to ATR.
Strength
Strength is the primary oscillator produced by the script.
Its exact calculation is:
Strength = (Close - TEWMA) / ATR
This value combines three important concepts:
* Price direction relative to the trend baseline.
* Distance from the trend baseline.
* Current market volatility.
The result is a normalized oscillator rather than a value expressed directly in price units.
Zero Line
The zero line is mathematically significant because it represents the point where:
Close = TEWMA
If the closing price moves above the TEWMA, strength becomes positive.
If the closing price moves below the TEWMA, strength becomes negative.
The zero line therefore separates positive and negative trend displacement.
EMA
The Exponential Moving Average assigns more weight to recent observations while retaining information from previous values.
In this script, EMA is used to smooth the calculated strength rather than the original price.
This distinction is important.
The indicator first calculates the complete ATR-normalized strength measurement and only then applies EMA smoothing.
The structure is therefore:
Price → TEWMA → ATR Normalized Strength → EMA
This allows the smoothing process to operate directly on the final trend-strength measurement.
Smoothed Strength
Smoothed strength is calculated as:
EMA(Strength, Smooth Length)
Because the input to the EMA is already normalized by ATR, the smoothed line represents the smoothed evolution of volatility-adjusted distance from the composite TEWMA.
This can help distinguish persistent strength from shorter-lived fluctuations in the raw oscillator.
The smoothing length determines how quickly the line responds.
A shorter smoothing length causes the smoothed measurement to react more quickly, while a longer smoothing length makes it more gradual.
Upper Threshold
The upper threshold determines when the strength measurement is considered sufficiently positive to trigger the bullish background condition.
With the default value of 1, the condition is:
Strength > 1
Because strength is normalized by ATR, this means the closing price is more than approximately one ATR above the composite TEWMA according to the current ATR calculation.
The same threshold is applied independently to the smoothed strength.
The threshold itself does not create a buy signal.
Lower Threshold
The lower threshold determines when the strength measurement enters the corresponding negative threshold region.
With the default value of -1, the condition is:
Strength < -1
This means the closing price is positioned more than approximately one ATR below the composite TEWMA.
The same concept is applied to the smoothed strength.
The lower threshold therefore acts as a normalized downside-strength boundary rather than a coded sell signal.
Volatility Normalization
Volatility normalization is one of the key concepts behind the indicator.
Without ATR normalization, the calculation would simply measure:
Close - TEWMA
That value is expressed in absolute price units.
By dividing it by ATR, the script asks a different question:
"How large is the price displacement relative to the market's recent typical range?"
This makes the strength value dependent on both price displacement and volatility.
That combination is particularly relevant when comparing periods in which the market's volatility changes substantially.
Trend Direction
The directional component of the indicator comes directly from the sign of the normalized strength.
Positive values indicate that price is above the composite TEWMA.
Negative values indicate that price is below the composite TEWMA.
The indicator therefore does not require a separate bullish/bearish calculation. Direction is inherently contained within the numerator of the strength formula.
Trend Strength
Trend strength is represented by the magnitude of the normalized value.
A value close to zero indicates that price is relatively close to the composite TEWMA when measured against ATR.
A larger positive value indicates greater positive displacement relative to ATR.
A larger negative value indicates greater negative displacement relative to ATR.
It is therefore important to distinguish direction from magnitude:
* The sign indicates which side of the TEWMA price is on.
* The magnitude indicates how far price is displaced relative to ATR.
Raw Strength vs. Smoothed Strength
The two oscillator components provide different information.
The raw strength responds directly to the latest relationship between closing price, TEWMA, and ATR.
The smoothed strength incorporates previous strength values through EMA smoothing.
This creates a useful distinction between immediate and persistent conditions.
A rapidly changing raw strength can reveal a developing change in the price-to-trend relationship, while the smoothed value can provide a slower representation of whether that change is becoming established.
The script therefore combines responsiveness and stability without requiring a second independent indicator.
Why Combine WMA and TEMA?
WMA and TEMA perform different roles in the calculation.
WMA provides weighted smoothing that places greater emphasis on recent observations.
TEMA then applies a multi-stage exponential smoothing structure intended to reduce lag compared with conventional moving averages.
Using them sequentially creates a trend baseline that is smoothed while still designed to remain responsive to changes in price.
The purpose is not simply to combine two moving-average names, but to create a specific transformation of the selected source before it is used in the strength calculation.
Why Use Two TEWMA Lengths?
A single moving-average length forces the indicator to represent trend using one specific time horizon.
The dual-length structure provides two different perspectives.
The shorter TEWMA can respond more quickly to changes in price structure.
The longer TEWMA changes more gradually and represents a broader trend component.
Averaging them produces the composite TEWMA used by the strength calculation.
This makes the baseline less dependent on a single smoothing horizon and combines faster and slower trend information into one reference value.
Why Combine TEWMA With ATR?
The TEWMA establishes the trend reference.
ATR establishes the volatility scale.
These measurements answer different questions.
The TEWMA asks:
"Where is the smoothed trend baseline?"
ATR asks:
"How large are the market's typical recent price movements?"
The strength calculation combines those two concepts by measuring the distance between price and trend baseline in ATR units.
This is what transforms the indicator from a simple moving-average distance oscillator into a volatility-adjusted trend-strength measurement.
Why Add EMA Smoothing to the Strength Measurement?
The raw strength calculation can fluctuate as price moves around the composite TEWMA.
Applying an EMA after normalization provides a second representation of that strength.
Importantly, the EMA is not smoothing the original price before the TEWMA calculation. It is smoothing the completed strength measurement.
This means the smoothed line represents the recent history of the normalized trend-strength state itself.
The combination therefore creates two layers:
Raw Strength = current normalized displacement
Smoothed Strength = smoothed normalized displacement
How the Components Work Together
The complete calculation can be simplified into the following chain:
Selected Source
↓
WMA using Primary Length
↓
TEMA using Primary Length
↓
TEWMA 1
And simultaneously:
Selected Source
↓
WMA using Primary Length × Multiplier
↓
TEMA using the Longer Length
↓
TEWMA 2
The two are then combined:
TEWMA 1 + TEWMA 2
↓
Average
↓
Composite TEWMA
At the same time:
High, Low and Close
↓
True Range
↓
ATR
The final strength calculation then becomes:
(Close - Composite TEWMA) / ATR
The resulting strength value is finally passed through:
EMA(Strength, Smoothing Length)
to create the smoothed strength measurement.
The entire indicator can therefore be summarized as:
Weighted price smoothing → TEMA lag reduction → dual-length trend baseline → ATR volatility normalization → strength oscillator → EMA strength smoothing
Visual Interpretation
The indicator uses several visual elements to make the calculations easier to interpret.
The raw strength line changes color according to whether it is above or below zero.
The smoothed strength line independently changes color according to its own relationship with zero.
The areas between each oscillator and the zero line are filled using the corresponding directional color.
The background highlights are reserved for conditions where the selected upper or lower threshold is exceeded.
This creates a visual hierarchy:
* Zero line = directional reference.
* Raw strength = immediate normalized displacement.
* Smoothed strength = slower strength state.
* Upper/lower thresholds = stronger normalized displacement regions.
* Background highlights = visual identification of threshold conditions.
Using the Indicator
The indicator can be used as a contextual trend-strength tool rather than as a standalone automated trading system.
The zero line can be used to identify whether price is currently above or below the composite TEWMA.
The raw strength can be observed when a trader wants a more responsive measurement of changes in the price-to-trend relationship.
The smoothed strength can be observed when a trader wants a slower representation of that same relationship.
The upper and lower thresholds can be adjusted to change how extreme a normalized displacement must become before the background highlights the condition.
Increasing the absolute threshold values makes the highlighted conditions more selective because a larger normalized displacement is required.
Reducing the absolute threshold values makes the threshold conditions easier to reach.
Similarly, changing the TEWMA lengths changes the responsiveness of the underlying trend baseline, while changing the ATR length changes the volatility reference used for normalization.
The smoothing length controls how quickly the smoothed strength responds to changes in the raw strength.
These parameters therefore influence different parts of the calculation rather than simply changing the same signal in different ways.
Important Considerations
This indicator measures the relationship between price, a composite TEWMA trend baseline, and ATR-based volatility.
It does not predict future prices and does not guarantee that a trend will continue after a strength condition appears.
A strong positive strength value means that price is currently positioned substantially above the composite TEWMA relative to the calculated ATR. It does not mathematically guarantee that price will continue higher.
Likewise, a strong negative value means that price is substantially below the composite TEWMA relative to ATR, but it does not guarantee continued downside movement.
The indicator also does not contain position sizing, stop-loss, take-profit, trade execution, or backtesting logic.
It should therefore be understood as a trend-strength and market-context tool, rather than a complete trading strategy.
Default Calculation Structure
With the default parameters, the indicator uses:
* Source: Close
* Primary Length: 50
* Multiplier: 2
* Secondary Length: 100
* ATR Length: 40
* Smoothing Length: 50
* Upper Threshold: 1
* Lower Threshold: -1
This results in a composite trend baseline constructed from 50-period and 100-period WMA-to-TEMA structures, followed by ATR normalization using a 40-period ATR and EMA smoothing of the resulting strength value using a 50-period EMA.
The default +1 and -1 thresholds represent positive and negative normalized displacement levels around the composite TEWMA.
Summary
TEWMA Trend Strength combines multiple calculations into one normalized trend-strength framework.
Rather than using a single moving average and simply checking whether price is above or below it, the script first constructs two TEWMA components using different lengths, averages them into a composite trend baseline, measures the distance between closing price and that baseline, and then normalizes that distance by ATR.
The result is a strength value where both direction and magnitude are meaningful.
The zero line identifies the side of the composite TEWMA on which price is currently positioned.
The magnitude of the value expresses that displacement relative to recent volatility.
The additional EMA smoothing provides a slower view of the strength condition, while the configurable upper and lower thresholds provide a visual way to identify larger normalized deviations.
The combination of WMA + TEMA creates the underlying trend representation, the dual-length structure combines faster and slower trend information, ATR converts the price displacement into a volatility-adjusted measurement, and EMA smoothing provides a second, slower representation of the resulting strength.
Together, these components form a single oscillator designed to help visualize trend direction, normalized trend strength, and the persistence of that strength within one calculation framework.
Enjoy!
Instead of simply determining whether price is above or below a single moving average, the indicator measures how far the current closing price is positioned from a composite trend baseline and normalizes that distance by market volatility using ATR. This produces a dimensionless trend-strength value that can be compared across different volatility environments.
The indicator combines two independently calculated TEWMA structures using different lengths. The first TEWMA is built from the selected source using the primary length, while the second uses a longer dynamically calculated length. These two TEWMA values are then averaged into one composite baseline.
The resulting distance between price and this composite baseline is divided by ATR. This normalization is important because a fixed price distance does not have the same meaning in every market or volatility regime. A move of 500 points can be extremely significant during a quiet market while being relatively insignificant during a highly volatile market. By measuring the distance relative to ATR, the indicator expresses the displacement in terms of the market's recent typical movement range.
A second, EMA-smoothed version of this strength measurement is also calculated. This provides a slower representation of the underlying trend-strength state while the raw strength value remains more responsive to current price movement.
The result is an oscillator designed to show both trend direction and relative trend strength in a single framework.
The indicator works by calculating in the following steps:
- Selecting the Price Source
The script begins with a user-selectable source, which defaults to the closing price.
This source is used as the foundation for the entire trend calculation. Because the source is configurable, the underlying calculation does not have to be restricted to the close. The selected source can be changed to other available price series depending on how the user wants the trend baseline to respond to market data.
Using a configurable source makes the underlying TEWMA calculation adaptable without changing the mathematical structure of the indicator. - Defining the Primary TEWMA Length
The user specifies the primary moving-average length through the Length parameter.
This length controls the first trend component of the indicator. A shorter length makes the underlying moving averages react more quickly to price changes, while a longer length produces a slower and more stable representation of the underlying trend.
The default value is 50. - Creating the Second TEWMA Length
The script then creates a second length by multiplying the primary length by the Multiplier parameter.
The calculation is:
Second Length = Primary Length × Multiplier
The resulting value is rounded to the nearest whole number because the moving-average functions require an integer length.
With the default settings:
50 × 2 = 100
Therefore, the first TEWMA uses a length of 50 while the second TEWMA uses a length of 100.
This creates two different trend perspectives: one more responsive and one slower. - Calculating the First Weighted Moving Average
The selected source is first processed through a Weighted Moving Average using the primary length.
A WMA assigns progressively different weights to the observations within its calculation window, giving more importance to more recent observations than older ones.
This means the WMA can react to recent price changes more quickly than a traditional SMA while still providing a smoother representation of price than using raw closing prices.
The first WMA therefore acts as the input into the first TEMA calculation. - Calculating the Second Weighted Moving Average
The same process is repeated using the dynamically calculated second length.
Because this length is normally larger than the primary length, the second WMA represents a slower-moving version of the underlying price structure.
With the default settings, the first WMA uses 50 periods while the second uses 100 periods.
This creates two different smoothing horizons before the data reaches the TEMA calculations. - Applying Triple Exponential Moving Average to the First WMA
The first WMA is passed through a Triple Exponential Moving Average (TEMA).
TEMA uses multiple stages of exponential smoothing to reduce the lag associated with conventional moving averages.
Conceptually, TEMA can be represented as:
TEMA = 3 × EMA1 - 3 × EMA2 + EMA3
Where:
EMA1 is the first EMA of the input.
EMA2 is an EMA of EMA1.
EMA3 is an EMA of EMA2.
The combination of these three stages is designed to reduce lag while retaining smoothing characteristics.
In this indicator, however, TEMA is not applied directly to raw price. It is applied to the already weighted price series produced by the WMA.
This creates a two-stage structure:
Price Source → WMA → TEMA
The resulting value is the first TEWMA component. - Applying Triple Exponential Moving Average to the Second WMA
The second WMA is independently passed through another TEMA calculation using the longer second length.
This produces the second TEWMA component.
The second component reacts more slowly because its underlying WMA uses a longer period. Consequently, it provides a broader representation of the market's trend structure.
The two components therefore serve different purposes within the same baseline:
* The shorter TEWMA provides a more responsive representation of the current trend.
* The longer TEWMA provides a slower representation of the broader trend structure. - Combining the Two TEWMA Components
The two TEWMA values are then averaged together.
The calculation is:
TEWMA = (TEWMA1 + TEWMA2) / 2
This creates a composite trend baseline rather than relying on only one moving-average length.
The benefit of averaging two different smoothing horizons is that the resulting baseline incorporates both a faster and a slower view of price structure.
The shorter component helps keep the baseline responsive, while the longer component provides additional stability.
This combination can reduce the dependence on a single arbitrary moving-average period and creates a more balanced representation of the underlying trend. - Calculating Average True Range
The script independently calculates Average True Range (ATR) using the user-defined ATR Length.
The default ATR length is 40.
ATR measures the recent trading range of the market while accounting for gaps between consecutive bars through the concept of True Range.
True Range is based on the greatest of:
* Current High minus Current Low
* Absolute value of Current High minus Previous Close
* Absolute value of Current Low minus Previous Close
ATR then smooths these True Range values over the selected period.
In this indicator, ATR is not being used as a traditional stop-loss or entry mechanism. Instead, it is used as a volatility normalization factor. - Calculating the Raw Trend Strength
The script measures the distance between the current closing price and the composite TEWMA.
The calculation is:
Strength = (Close - TEWMA) / ATR
This is one of the most important calculations in the indicator.
First, the script calculates:
Close - TEWMA
This determines whether price is above or below the composite trend baseline and by how much.
If the result is positive, the closing price is above the TEWMA.
If the result is negative, the closing price is below the TEWMA.
The difference is then divided by ATR.
This converts the raw price distance into a volatility-adjusted measurement.
For example, a distance of 100 price units does not have the same significance in a market with an ATR of 20 as it does in a market with an ATR of 200.
When ATR is 20:
100 / 20 = 5
When ATR is 200:
100 / 200 = 0.5
The same absolute price distance therefore produces very different strength readings depending on the market's volatility.
This is the primary reason for incorporating ATR into the strength calculation. - Interpreting the Zero Line
Because the strength calculation is based on Close - TEWMA, the zero line has a direct mathematical meaning.
When:
Strength > 0
the closing price is above the composite TEWMA.
When:
Strength < 0
the closing price is below the composite TEWMA.
Therefore, the zero line represents the point where price and the composite TEWMA are equal.
This makes the zero line the central directional reference of the oscillator. - Smoothing the Strength Measurement
The raw strength value is then passed through an Exponential Moving Average.
The smoothing period is controlled by Smoothing Length, which defaults to 50.
The calculation can therefore be represented as:
Smoothed Strength = EMA(Strength, Smoothing Length)
Unlike the raw strength measurement, which reacts directly to changes in the current price-to-TEWMA relationship, the smoothed line incorporates previous strength values.
Because EMA gives greater weight to more recent observations, it remains responsive while filtering out some of the shorter-term fluctuations in the raw oscillator.
This creates two complementary views:
* Raw Strength shows the more immediate price displacement from the TEWMA.
* Smoothed Strength shows a slower representation of the underlying strength condition. - Assigning the Raw Strength Trend Color
The raw strength line changes color according to whether its value is above or below zero.
When strength is positive, the line uses the bullish color.
When strength is negative, the line uses the bearish color.
The color therefore directly corresponds to the mathematical relationship between price and the composite TEWMA.
It does not represent a separate calculation or additional signal filter. - Assigning the Smoothed Strength Trend Color
The same directional concept is applied to the smoothed strength line.
When the smoothed strength is above zero, it receives the bullish color.
When the smoothed strength is below zero, it receives the bearish color.
This makes it possible to visually distinguish the current normalized strength state from the slower smoothed state. - Plotting the Raw Strength
The raw strength value is plotted as the primary oscillator.
Because the indicator is declared with overlay = false, the oscillator is displayed in its own pane rather than directly over the price chart.
The raw strength plot uses a thicker line to emphasize the more responsive component of the calculation. - Filling Between Raw Strength and Zero
The script also creates an invisible zero reference plot and fills the area between the raw strength line and zero.
The fill follows the same bullish or bearish color assignment as the raw strength line.
This makes positive and negative deviations visually easier to identify.
When the oscillator is above zero, the area between the strength line and zero represents positive displacement from the TEWMA.
When it is below zero, the corresponding area represents negative displacement. - Plotting the Smoothed Strength
The smoothed strength is plotted separately using a thinner line.
Because this line is an EMA of the raw strength, it reacts more gradually to changes.
This makes it useful for visually separating short-term fluctuations in normalized trend strength from the broader strength condition represented by the smoothed value. - Filling Between Smoothed Strength and Zero
The indicator also fills the area between the smoothed strength line and zero.
The fill color follows whether the smoothed strength is positive or negative.
Consequently, the oscillator visually contains two layers of information:
* The raw strength component.
* The smoothed strength component. - Defining the Upper Strength Threshold
The Upper parameter defines a positive threshold for the background strength condition.
Its default value is 1.
The script checks whether the raw strength exceeds this threshold:
Strength > Upper
When that condition is true, the chart background receives a bullish background highlight.
The same upper threshold is also applied to the smoothed strength:
Smoothed Strength > Upper
This means the background can identify situations where normalized strength has moved beyond the selected positive threshold. - Defining the Lower Strength Threshold
The Lower parameter defines the negative threshold.
Its default value is -1.
The raw strength is checked against:
Strength < Lower
and the smoothed strength is checked against:
Smoothed Strength < Lower
When either respective condition is met, the corresponding bearish background condition is applied.
The default range therefore places the main strength thresholds at approximately +1 and -1 ATR of normalized displacement from the composite TEWMA. - Background Regime Visualization
The script uses the threshold calculations to create background highlights on the chart.
The raw strength produces a bullish background condition when it exceeds the upper threshold and a bearish background condition when it falls below the lower threshold.
The smoothed strength uses the same threshold framework.
Values between the upper and lower thresholds do not receive the bullish or bearish threshold highlight.
This creates a visual distinction between ordinary positive/negative displacement and stronger normalized displacement.
Buy and Sell Conditions:
This indicator does not contain explicit buy or sell conditions, entries, exits, alerts, or trade execution logic.
Instead, it is designed as a trend-strength oscillator.
The primary directional interpretation comes from the zero line:
* When the raw strength is above 0, price is above the composite TEWMA.
* When the raw strength is below 0, price is below the composite TEWMA.
* When the smoothed strength is above 0, the smoothed trend-strength state is positive.
* When the smoothed strength is below 0, the smoothed trend-strength state is negative.
The upper and lower thresholds provide an additional measurement of the magnitude of the normalized displacement:
* Strength above the upper threshold indicates that price is positioned more than the selected positive ATR multiple above the composite TEWMA.
* Strength below the lower threshold indicates that price is positioned more than the selected negative ATR multiple below the composite TEWMA.
The smoothed line can be used to observe whether the broader strength condition agrees with the raw strength measurement.
For example, a user may choose to interpret a positive raw strength together with positive smoothed strength as stronger directional alignment than a positive raw strength value occurring while the smoothed measurement remains negative.
However, these are interpretations of the indicator's measurements rather than coded buy or sell rules. The script itself does not automatically define a trade entry simply because one of these conditions occurs.
This distinction is important because the indicator measures market structure and normalized trend strength rather than providing a complete trading strategy.
Features and Parameters:
* Source - Selects the price series used as the input for the WMA calculations. The default source is Close.
* Length - Defines the primary length used for the first WMA and TEMA calculation. The default value is 50.
* Multiplier - Multiplies the primary length to determine the second TEWMA length. The default value is 2. With a Length of 50, this produces a second length of 100.
* ATR Length - Determines the period used to calculate ATR for volatility normalization. The default value is 40.
* Smoothing Length - Determines the EMA period used to smooth the raw strength measurement. The default value is 50.
* Upper - Defines the positive normalized-strength threshold used for the bullish background condition. The default value is 1.
* Lower - Defines the negative normalized-strength threshold used for the bearish background condition. The default value is -1.
* Raw Strength - Displays the current ATR-normalized distance between closing price and the composite TEWMA.
* Smoothed Strength - Displays an EMA-smoothed version of the raw strength measurement.
* Zero Line - Represents the point where closing price is equal to the composite TEWMA.
* Threshold Backgrounds - Visually highlights situations where raw or smoothed strength exceeds the configured upper or lower thresholds.
Specifications:
Weighted Moving Average (WMA)
The Weighted Moving Average is a moving average that assigns different weights to the observations within its calculation period.
More recent values receive greater influence than older values.
Compared with a Simple Moving Average, which gives every observation the same weight, WMA emphasizes the more recent portion of the selected price history.
In this indicator, WMA is used as the first smoothing stage before the data enters the TEMA calculation.
This creates a smoother input for TEMA while retaining greater responsiveness to recent price changes than an equally weighted average.
Triple Exponential Moving Average (TEMA)
Triple Exponential Moving Average is a multi-stage exponential smoothing method designed to reduce the lag that can occur with conventional moving averages.
The underlying calculation uses three consecutive EMA stages:
EMA1 = EMA(Input)
EMA2 = EMA(EMA1)
EMA3 = EMA(EMA2)
These are combined approximately as:
TEMA = 3 × EMA1 - 3 × EMA2 + EMA3
The mathematical combination attempts to compensate for some of the lag introduced by repeated exponential smoothing.
In this indicator, TEMA is applied after WMA rather than directly to price.
This creates the specific structure:
Selected Source → WMA → TEMA
That combination is the basis of the indicator's TEWMA concept.
TEWMA
TEWMA in this script refers to the combination of a Weighted Moving Average and a Triple Exponential Moving Average.
Each TEWMA component is therefore produced through a WMA followed by TEMA.
The script creates two separate TEWMA values using different lengths.
The first uses the primary length.
The second uses the primary length multiplied by the user-defined multiplier.
The two resulting values are then averaged.
This gives the final baseline a combination of a faster and slower trend perspective.
Dual-Length TEWMA Structure
The indicator does not rely on a single TEWMA.
Instead, it calculates:
TEWMA1 = TEMA(WMA(Source, Length), Length)
and:
TEWMA2 = TEMA(WMA(Source, Length2), Length2)
where:
Length2 = round(Length × Multiplier)
The two values are then averaged.
This is important because a single moving-average length represents only one smoothing horizon.
The dual-length structure allows the composite baseline to incorporate both a more responsive trend component and a slower trend component.
The averaging process creates a single reference value from those two perspectives.
Composite TEWMA
The final TEWMA is calculated as:
TEWMA = average(TEWMA1, TEWMA2)
or mathematically:
TEWMA = (TEWMA1 + TEWMA2) / 2
This composite value acts as the central trend baseline of the entire indicator.
Every raw strength value is calculated relative to this baseline.
Therefore, the TEWMA is not simply plotted as a moving average for visual reference; it directly determines the numerator of the strength calculation.
Average True Range (ATR)
Average True Range is a volatility measurement that estimates the typical trading range of the market over a selected period.
It is based on True Range, which accounts for both the current candle's high-low range and gaps relative to the previous closing price.
The ATR is used here as a normalization factor.
This is a critical part of the indicator because the raw distance between price and TEWMA is not directly comparable across different volatility conditions.
Dividing the price displacement by ATR expresses the distance in volatility-adjusted terms.
The resulting value can therefore be interpreted as the approximate number of ATR units that price is positioned above or below the composite TEWMA.
ATR Normalization
The core normalization is:
(Close - TEWMA) / ATR
The numerator determines direction and absolute displacement.
The denominator determines the scale of the market's recent volatility.
This combination allows the indicator to transform a raw price difference into a normalized strength measurement.
A positive result means price is above the TEWMA.
A negative result means price is below the TEWMA.
The magnitude indicates how large that displacement is relative to ATR.
Strength
Strength is the primary oscillator produced by the script.
Its exact calculation is:
Strength = (Close - TEWMA) / ATR
This value combines three important concepts:
* Price direction relative to the trend baseline.
* Distance from the trend baseline.
* Current market volatility.
The result is a normalized oscillator rather than a value expressed directly in price units.
Zero Line
The zero line is mathematically significant because it represents the point where:
Close = TEWMA
If the closing price moves above the TEWMA, strength becomes positive.
If the closing price moves below the TEWMA, strength becomes negative.
The zero line therefore separates positive and negative trend displacement.
EMA
The Exponential Moving Average assigns more weight to recent observations while retaining information from previous values.
In this script, EMA is used to smooth the calculated strength rather than the original price.
This distinction is important.
The indicator first calculates the complete ATR-normalized strength measurement and only then applies EMA smoothing.
The structure is therefore:
Price → TEWMA → ATR Normalized Strength → EMA
This allows the smoothing process to operate directly on the final trend-strength measurement.
Smoothed Strength
Smoothed strength is calculated as:
EMA(Strength, Smooth Length)
Because the input to the EMA is already normalized by ATR, the smoothed line represents the smoothed evolution of volatility-adjusted distance from the composite TEWMA.
This can help distinguish persistent strength from shorter-lived fluctuations in the raw oscillator.
The smoothing length determines how quickly the line responds.
A shorter smoothing length causes the smoothed measurement to react more quickly, while a longer smoothing length makes it more gradual.
Upper Threshold
The upper threshold determines when the strength measurement is considered sufficiently positive to trigger the bullish background condition.
With the default value of 1, the condition is:
Strength > 1
Because strength is normalized by ATR, this means the closing price is more than approximately one ATR above the composite TEWMA according to the current ATR calculation.
The same threshold is applied independently to the smoothed strength.
The threshold itself does not create a buy signal.
Lower Threshold
The lower threshold determines when the strength measurement enters the corresponding negative threshold region.
With the default value of -1, the condition is:
Strength < -1
This means the closing price is positioned more than approximately one ATR below the composite TEWMA.
The same concept is applied to the smoothed strength.
The lower threshold therefore acts as a normalized downside-strength boundary rather than a coded sell signal.
Volatility Normalization
Volatility normalization is one of the key concepts behind the indicator.
Without ATR normalization, the calculation would simply measure:
Close - TEWMA
That value is expressed in absolute price units.
By dividing it by ATR, the script asks a different question:
"How large is the price displacement relative to the market's recent typical range?"
This makes the strength value dependent on both price displacement and volatility.
That combination is particularly relevant when comparing periods in which the market's volatility changes substantially.
Trend Direction
The directional component of the indicator comes directly from the sign of the normalized strength.
Positive values indicate that price is above the composite TEWMA.
Negative values indicate that price is below the composite TEWMA.
The indicator therefore does not require a separate bullish/bearish calculation. Direction is inherently contained within the numerator of the strength formula.
Trend Strength
Trend strength is represented by the magnitude of the normalized value.
A value close to zero indicates that price is relatively close to the composite TEWMA when measured against ATR.
A larger positive value indicates greater positive displacement relative to ATR.
A larger negative value indicates greater negative displacement relative to ATR.
It is therefore important to distinguish direction from magnitude:
* The sign indicates which side of the TEWMA price is on.
* The magnitude indicates how far price is displaced relative to ATR.
Raw Strength vs. Smoothed Strength
The two oscillator components provide different information.
The raw strength responds directly to the latest relationship between closing price, TEWMA, and ATR.
The smoothed strength incorporates previous strength values through EMA smoothing.
This creates a useful distinction between immediate and persistent conditions.
A rapidly changing raw strength can reveal a developing change in the price-to-trend relationship, while the smoothed value can provide a slower representation of whether that change is becoming established.
The script therefore combines responsiveness and stability without requiring a second independent indicator.
Why Combine WMA and TEMA?
WMA and TEMA perform different roles in the calculation.
WMA provides weighted smoothing that places greater emphasis on recent observations.
TEMA then applies a multi-stage exponential smoothing structure intended to reduce lag compared with conventional moving averages.
Using them sequentially creates a trend baseline that is smoothed while still designed to remain responsive to changes in price.
The purpose is not simply to combine two moving-average names, but to create a specific transformation of the selected source before it is used in the strength calculation.
Why Use Two TEWMA Lengths?
A single moving-average length forces the indicator to represent trend using one specific time horizon.
The dual-length structure provides two different perspectives.
The shorter TEWMA can respond more quickly to changes in price structure.
The longer TEWMA changes more gradually and represents a broader trend component.
Averaging them produces the composite TEWMA used by the strength calculation.
This makes the baseline less dependent on a single smoothing horizon and combines faster and slower trend information into one reference value.
Why Combine TEWMA With ATR?
The TEWMA establishes the trend reference.
ATR establishes the volatility scale.
These measurements answer different questions.
The TEWMA asks:
"Where is the smoothed trend baseline?"
ATR asks:
"How large are the market's typical recent price movements?"
The strength calculation combines those two concepts by measuring the distance between price and trend baseline in ATR units.
This is what transforms the indicator from a simple moving-average distance oscillator into a volatility-adjusted trend-strength measurement.
Why Add EMA Smoothing to the Strength Measurement?
The raw strength calculation can fluctuate as price moves around the composite TEWMA.
Applying an EMA after normalization provides a second representation of that strength.
Importantly, the EMA is not smoothing the original price before the TEWMA calculation. It is smoothing the completed strength measurement.
This means the smoothed line represents the recent history of the normalized trend-strength state itself.
The combination therefore creates two layers:
Raw Strength = current normalized displacement
Smoothed Strength = smoothed normalized displacement
How the Components Work Together
The complete calculation can be simplified into the following chain:
Selected Source
↓
WMA using Primary Length
↓
TEMA using Primary Length
↓
TEWMA 1
And simultaneously:
Selected Source
↓
WMA using Primary Length × Multiplier
↓
TEMA using the Longer Length
↓
TEWMA 2
The two are then combined:
TEWMA 1 + TEWMA 2
↓
Average
↓
Composite TEWMA
At the same time:
High, Low and Close
↓
True Range
↓
ATR
The final strength calculation then becomes:
(Close - Composite TEWMA) / ATR
The resulting strength value is finally passed through:
EMA(Strength, Smoothing Length)
to create the smoothed strength measurement.
The entire indicator can therefore be summarized as:
Weighted price smoothing → TEMA lag reduction → dual-length trend baseline → ATR volatility normalization → strength oscillator → EMA strength smoothing
Visual Interpretation
The indicator uses several visual elements to make the calculations easier to interpret.
The raw strength line changes color according to whether it is above or below zero.
The smoothed strength line independently changes color according to its own relationship with zero.
The areas between each oscillator and the zero line are filled using the corresponding directional color.
The background highlights are reserved for conditions where the selected upper or lower threshold is exceeded.
This creates a visual hierarchy:
* Zero line = directional reference.
* Raw strength = immediate normalized displacement.
* Smoothed strength = slower strength state.
* Upper/lower thresholds = stronger normalized displacement regions.
* Background highlights = visual identification of threshold conditions.
Using the Indicator
The indicator can be used as a contextual trend-strength tool rather than as a standalone automated trading system.
The zero line can be used to identify whether price is currently above or below the composite TEWMA.
The raw strength can be observed when a trader wants a more responsive measurement of changes in the price-to-trend relationship.
The smoothed strength can be observed when a trader wants a slower representation of that same relationship.
The upper and lower thresholds can be adjusted to change how extreme a normalized displacement must become before the background highlights the condition.
Increasing the absolute threshold values makes the highlighted conditions more selective because a larger normalized displacement is required.
Reducing the absolute threshold values makes the threshold conditions easier to reach.
Similarly, changing the TEWMA lengths changes the responsiveness of the underlying trend baseline, while changing the ATR length changes the volatility reference used for normalization.
The smoothing length controls how quickly the smoothed strength responds to changes in the raw strength.
These parameters therefore influence different parts of the calculation rather than simply changing the same signal in different ways.
Important Considerations
This indicator measures the relationship between price, a composite TEWMA trend baseline, and ATR-based volatility.
It does not predict future prices and does not guarantee that a trend will continue after a strength condition appears.
A strong positive strength value means that price is currently positioned substantially above the composite TEWMA relative to the calculated ATR. It does not mathematically guarantee that price will continue higher.
Likewise, a strong negative value means that price is substantially below the composite TEWMA relative to ATR, but it does not guarantee continued downside movement.
The indicator also does not contain position sizing, stop-loss, take-profit, trade execution, or backtesting logic.
It should therefore be understood as a trend-strength and market-context tool, rather than a complete trading strategy.
Default Calculation Structure
With the default parameters, the indicator uses:
* Source: Close
* Primary Length: 50
* Multiplier: 2
* Secondary Length: 100
* ATR Length: 40
* Smoothing Length: 50
* Upper Threshold: 1
* Lower Threshold: -1
This results in a composite trend baseline constructed from 50-period and 100-period WMA-to-TEMA structures, followed by ATR normalization using a 40-period ATR and EMA smoothing of the resulting strength value using a 50-period EMA.
The default +1 and -1 thresholds represent positive and negative normalized displacement levels around the composite TEWMA.
Summary
TEWMA Trend Strength combines multiple calculations into one normalized trend-strength framework.
Rather than using a single moving average and simply checking whether price is above or below it, the script first constructs two TEWMA components using different lengths, averages them into a composite trend baseline, measures the distance between closing price and that baseline, and then normalizes that distance by ATR.
The result is a strength value where both direction and magnitude are meaningful.
The zero line identifies the side of the composite TEWMA on which price is currently positioned.
The magnitude of the value expresses that displacement relative to recent volatility.
The additional EMA smoothing provides a slower view of the strength condition, while the configurable upper and lower thresholds provide a visual way to identify larger normalized deviations.
The combination of WMA + TEMA creates the underlying trend representation, the dual-length structure combines faster and slower trend information, ATR converts the price displacement into a volatility-adjusted measurement, and EMA smoothing provides a second, slower representation of the resulting strength.
Together, these components form a single oscillator designed to help visualize trend direction, normalized trend strength, and the persistence of that strength within one calculation framework.
Enjoy!

免责声明
这些信息和出版物并非旨在提供,也不构成TradingView提供或认可的任何形式的财务、投资、交易或其他类型的建议或推荐。请阅读使用条款了解更多信息。
免责声明
这些信息和出版物并非旨在提供,也不构成TradingView提供或认可的任何形式的财务、投资、交易或其他类型的建议或推荐。请阅读使用条款了解更多信息。