OPEN-SOURCE SCRIPT
已更新 Kalman Trailing Stop (KTS)
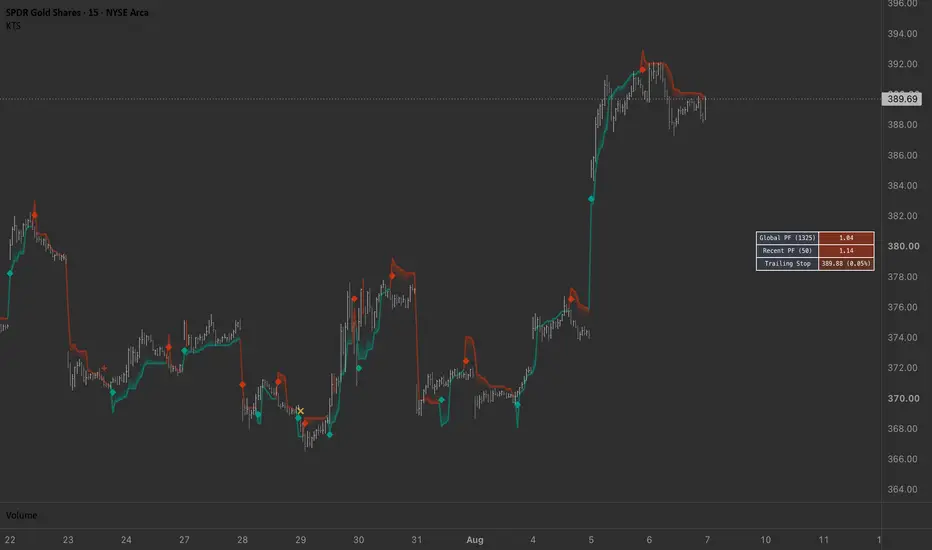
█ OVERVIEW
The Kalman Trailing Stop (KTS) is an advanced, math-driven trend-following system designed to keep you in winning trades longer while dynamically filtering out market noise.
Instead of relying on static moving averages or basic ATR multipliers, KTS utilizes a 2D Kalman Filter combined with Statistical Digital Signal Processing (DSP) and Williams Market Structure. It adapts to volatility and volume in real-time, effectively distinguishing between genuine trend shifts and temporary liquidity sweeps.
█ CORE MECHANICS
1. 2D Kalman Adaptive Trailing Stop
At the heart of the indicator is a robust 2D Kalman filter that tracks both price level and velocity.
2. Statistical Plunger Logic (Liquidity Sweeps)
Markets frequently sweep liquidity beyond technical levels before reversing. The "Plunger" logic mathematically identifies these traps.
3. Algorithmic Pyramiding & Volatility Warnings
4. Built-in Risk & Performance Engine
█ VISUAL GUIDE
█ SETTINGS
Kalman Trailing Stop Settings
Disclaimer
This script is designed for educational and informational purposes only. Trading involves significant risk. The built-in performance table is an un-optimized raw calculation and should not be used as a guarantee of future system profitability.
The Kalman Trailing Stop (KTS) is an advanced, math-driven trend-following system designed to keep you in winning trades longer while dynamically filtering out market noise.
Instead of relying on static moving averages or basic ATR multipliers, KTS utilizes a 2D Kalman Filter combined with Statistical Digital Signal Processing (DSP) and Williams Market Structure. It adapts to volatility and volume in real-time, effectively distinguishing between genuine trend shifts and temporary liquidity sweeps.
█ CORE MECHANICS
1. 2D Kalman Adaptive Trailing Stop
At the heart of the indicator is a robust 2D Kalman filter that tracks both price level and velocity.
- Volume-Weighted Variance: The trailing stop becomes highly responsive during high-volume pushes (high trust) and flattens out during low-volume consolidation (low trust), preventing premature stop-outs.
- Sigmoid Smoothing & Structural Anchoring: Instead of jagged, abrupt jumps, the stop uses sigmoid transitions to smoothly glide to new structural floors/ceilings derived from recent Intermediate-Term Highs and Lows (ITH/ITL).
- Slope Confirmation: The trailing stop will only flip its directional bias if the underlying Kalman baseline slope confirms the reversal, neutralizing fake-outs.
2. Statistical Plunger Logic (Liquidity Sweeps)
Markets frequently sweep liquidity beyond technical levels before reversing. The "Plunger" logic mathematically identifies these traps.
- Dynamic Sweep Multiplier: By tracking the kurtosis (fat-tail distribution) of price returns, the script dynamically expands its sweep threshold during periods of wild volatility.
- Wick Filtering: It detects deep wicks that pierce the Kalman bands and close strongly back within the bar's range, highlighting statistically validated exhaustion points.
3. Algorithmic Pyramiding & Volatility Warnings
- Scale-In Detection: KTS monitors volume footprints to identify safe zones to add to your position. It looks for a sequence of volume "dry-up" during a pullback, followed by a volume-backed breakout past recent market structure.
- Livermore Ejector Concept: The indicator flags abnormal, massive range expansions that occur against the prevailing trend, acting as an early warning system for sudden momentum shifts.
4. Built-in Risk & Performance Engine
- Dynamic Position Sizing: Automatically calculates raw position and pyramid sizes based on your account equity, risk percentage, and maximum leverage.
- Live Performance Dashboard: A built-in HUD tracks both the Global and Recent Profit Factor (PF) of the main trend signals, alongside the real-time distance to your trailing stop.
█ VISUAL GUIDE
- Colored Gradient Band: The main Kalman Trailing Stop. Green indicates an active long trend; Red indicates an active short trend.
- Large Diamonds (♦️): Main Trend Entries. Triggered when price breaks the Kalman Stop with slope confirmation.
- Small Triangles (🔼/🔽): Bullish and Bearish Plunger signals. These indicate deep liquidity sweeps and wick rejections at statistical extremes.
- Small Crosses (➕): Algorithmic Pyramid signals. Opportunities to scale into the current trend based on volume dry-ups and structural breakouts.
- Yellow X-Crosses (❌): Abnormal Reaction Warnings. Signals a massive volatility spike moving against your active position.
█ SETTINGS
Kalman Trailing Stop Settings
- Kalman Responsiveness: Adjusts how quickly the system reacts to price changes (1-100).
- Trailing Stop Distance (SD): Sets the baseline width of the trailing stop from the Kalman-smoothed price, measured in standard deviations of the True Range. A higher value (e.g., 3.0) gives the trade more breathing room, while a lower value tightens the stop.
Disclaimer
This script is designed for educational and informational purposes only. Trading involves significant risk. The built-in performance table is an un-optimized raw calculation and should not be used as a guarantee of future system profitability.
版本注释
Add a new 'Enable 3D Oscillator State' toggle. This implements Benhamou's Model 4 (a 3D Kalman state) to dynamically tighten the trailing stop when price is overextended.版本注释
clean chart开源脚本
秉承TradingView的精神,该脚本的作者将其开源,以便交易者可以查看和验证其功能。向作者致敬!您可以免费使用该脚本,但请记住,重新发布代码须遵守我们的网站规则。

免责声明
这些信息和出版物并非旨在提供,也不构成TradingView提供或认可的任何形式的财务、投资、交易或其他类型的建议或推荐。请阅读使用条款了解更多信息。
免责声明
这些信息和出版物并非旨在提供,也不构成TradingView提供或认可的任何形式的财务、投资、交易或其他类型的建议或推荐。请阅读使用条款了解更多信息。