OPEN-SOURCE SCRIPT
BIST Fibonacci Retracement Scanner
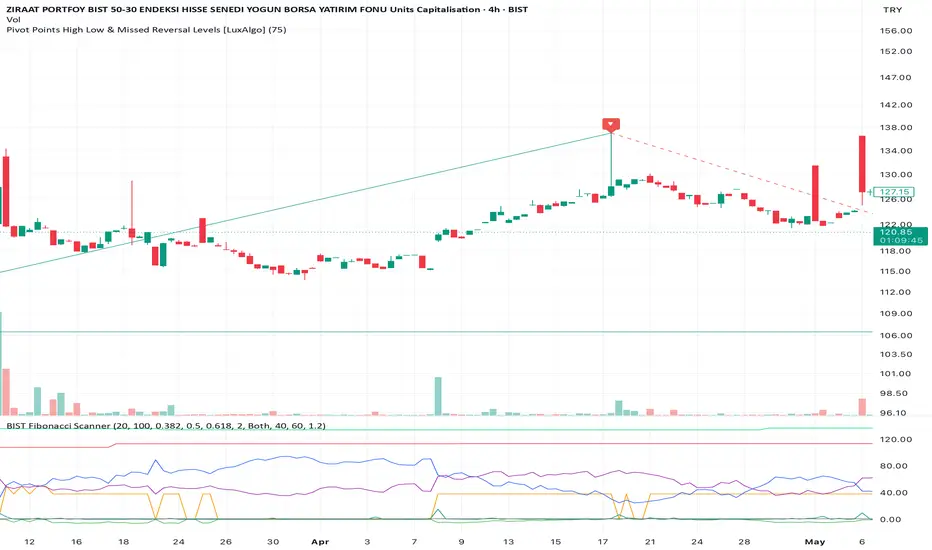
Automatically detects swing highs/lows, determines trend direction, and finds stocks currently sitting at key Fibonacci retracement levels — potential buy or sell zones.
━━━━━━━━━━━━━━━━━━━━━━━━━━━━
📌 HOW IT WORKS
1. Detects significant swing points using pivot analysis
2. Determines trend: higher lows = uptrend, lower highs = downtrend
3. Calculates Fibonacci retracement levels between swing points
4. Flags stocks where price is near a Fib level (within configurable tolerance)
• Uptrend pullback to Fib support → BUY zone
• Downtrend bounce to Fib resistance → SELL/AVOID zone
━━━━━━━━━━━━━━━━━━━━━━━━━━━━
📊 SCREENER COLUMNS
• SIGNAL — 1 when price is at a Fib level (use this to filter)
• Trend — 1 = uptrend (buy zone), -1 = downtrend (sell zone)
• Fib Level Hit — Which level triggered: 38.2%, 50%, or 61.8%
• Dist from Fib — How close price is to the exact level
• Retracement Depth — How deep the pullback is from the swing high
• RSI / Volume — Extra confirmation data
━━━━━━━━━━━━━━━━━━━━━━━━━━━━
⚙️ SETTINGS
• Swing Lookback: Pivot detection period (default: 20 bars)
• Fib Levels: 0.382 / 0.5 / 0.618 — toggle each on/off
• Tolerance: How close to Fib line to trigger (default: 2%)
• Trend Filter: Uptrend only / Downtrend only / Both
• Optional: RSI and Volume confirmation filters
━━━━━━━━━━━━━━━━━━━━━━━━━━━━
🎯 BEST USED WITH
Pine Screener → BIST watchlist → Filter SIGNAL = 1 → Sort by Fib Level or Retracement Depth
━━━━━━━━━━━━━━━━━━━━━━━━━━━━
⚠️ DISCLAIMER
This indicator is for educational and informational purposes only. It does not constitute financial advice. Always do your own analysis before making trading decisions. Past performance does not
guarantee future results.
━━━━━━━━━━━━━━━━━━━━━━━━━━━━
📌 HOW IT WORKS
1. Detects significant swing points using pivot analysis
2. Determines trend: higher lows = uptrend, lower highs = downtrend
3. Calculates Fibonacci retracement levels between swing points
4. Flags stocks where price is near a Fib level (within configurable tolerance)
• Uptrend pullback to Fib support → BUY zone
• Downtrend bounce to Fib resistance → SELL/AVOID zone
━━━━━━━━━━━━━━━━━━━━━━━━━━━━
📊 SCREENER COLUMNS
• SIGNAL — 1 when price is at a Fib level (use this to filter)
• Trend — 1 = uptrend (buy zone), -1 = downtrend (sell zone)
• Fib Level Hit — Which level triggered: 38.2%, 50%, or 61.8%
• Dist from Fib — How close price is to the exact level
• Retracement Depth — How deep the pullback is from the swing high
• RSI / Volume — Extra confirmation data
━━━━━━━━━━━━━━━━━━━━━━━━━━━━
⚙️ SETTINGS
• Swing Lookback: Pivot detection period (default: 20 bars)
• Fib Levels: 0.382 / 0.5 / 0.618 — toggle each on/off
• Tolerance: How close to Fib line to trigger (default: 2%)
• Trend Filter: Uptrend only / Downtrend only / Both
• Optional: RSI and Volume confirmation filters
━━━━━━━━━━━━━━━━━━━━━━━━━━━━
🎯 BEST USED WITH
Pine Screener → BIST watchlist → Filter SIGNAL = 1 → Sort by Fib Level or Retracement Depth
━━━━━━━━━━━━━━━━━━━━━━━━━━━━
⚠️ DISCLAIMER
This indicator is for educational and informational purposes only. It does not constitute financial advice. Always do your own analysis before making trading decisions. Past performance does not
guarantee future results.
开源脚本
秉承TradingView的精神,该脚本的作者将其开源,以便交易者可以查看和验证其功能。向作者致敬!您可以免费使用该脚本,但请记住,重新发布代码须遵守我们的网站规则。

免责声明
这些信息和出版物并非旨在提供,也不构成TradingView提供或认可的任何形式的财务、投资、交易或其他类型的建议或推荐。请阅读使用条款了解更多信息。
开源脚本
秉承TradingView的精神,该脚本的作者将其开源,以便交易者可以查看和验证其功能。向作者致敬!您可以免费使用该脚本,但请记住,重新发布代码须遵守我们的网站规则。
免责声明
这些信息和出版物并非旨在提供,也不构成TradingView提供或认可的任何形式的财务、投资、交易或其他类型的建议或推荐。请阅读使用条款了解更多信息。