HS SP500 1.6x Long Benchmark
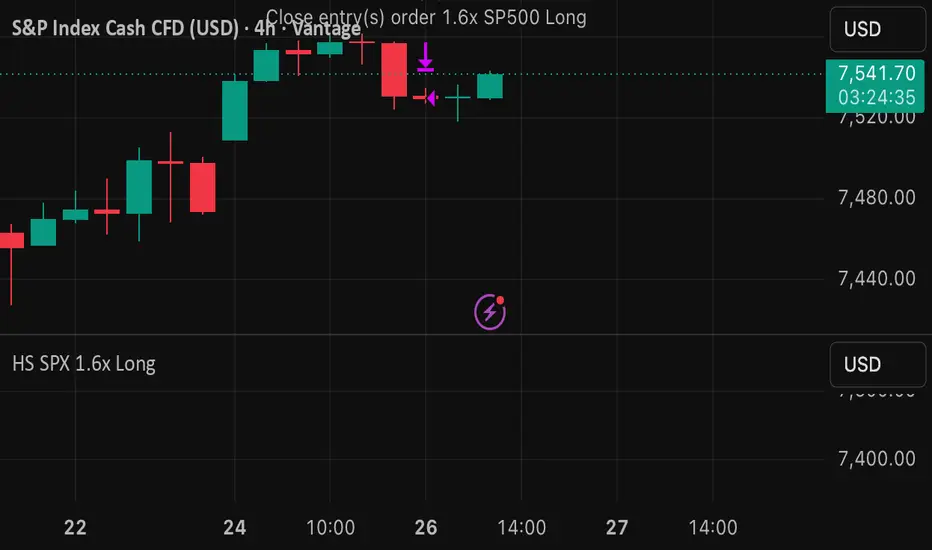
Long-only SP500 benchmark strategy using 160% notional exposure.
This is not a predictive trading signal. It is a transparent leveraged benchmark designed to compare 1.6x long SP500 exposure against TradingView’s Buy & Hold benchmark over the same historical window.
Backtest target used:
VANTAGE:SP500, 4h, Mar 16, 2018 to May 26, 2026.
The strategy models:
160% of equity position sizing, 0.075% commission, 2 ticks slippage, and 50% long margin.
Expected behavior: if applied to the same SP500 chart and date window, it should outperform 1x Buy & Hold by roughly the leverage factor, while also carrying larger drawdowns and margin risk.

免责声明
这些信息和出版物并非旨在提供,也不构成TradingView提供或认可的任何形式的财务、投资、交易或其他类型的建议或推荐。请阅读使用条款了解更多信息。
免责声明
这些信息和出版物并非旨在提供,也不构成TradingView提供或认可的任何形式的财务、投资、交易或其他类型的建议或推荐。请阅读使用条款了解更多信息。